Volume Zone Oscillator - Floating Levels
This tool for MetaTrader 5 is specifically engineered to streamline your trading operations. This technical indicator acts as a specialized analysis tool designed to visualize market data. It helps traders identify emerging trends, momentum shifts, and key support or resistance levels by plotting statistical calculations directly onto price charts.
How to Setup and Use Volume Zone Oscillator - Floating Levels
1. Installation: Place your file in the MQL/Indicators folder via "Open Data Folder" and restart your terminal.
2. Loading: Find the indicator in the Navigator, drag it onto your chart, and configure the input parameters in the popup window.
3. Customization: Press Ctrl+I to open the indicator list, select your tool, and click "Properties" to change colors, levels, or visual styles.
4. Updating: Replace the old file in the Indicators folder with the new version and restart the platform to apply changes.
Frequently Asked Questions
Q: Why is my indicator not showing? A: Verify the file is in the MQL/Indicators folder, or try right-clicking the "Indicators" tree in the Navigator and clicking "Refresh."
Q: Do custom indicators slow down the platform? A: Too many complex indicators can impact performance; remove unused ones via the "Indicator List" (Ctrl+I).
Q: Can I use MT4 indicators on MT5? A: No, MQL4 and MQL5 are distinct languages; ensure the indicator is compiled specifically for your platform version.
Description & Settings
Indicator is based on the "In The Volume Zone" article by Walid Khalil and David Steckler.
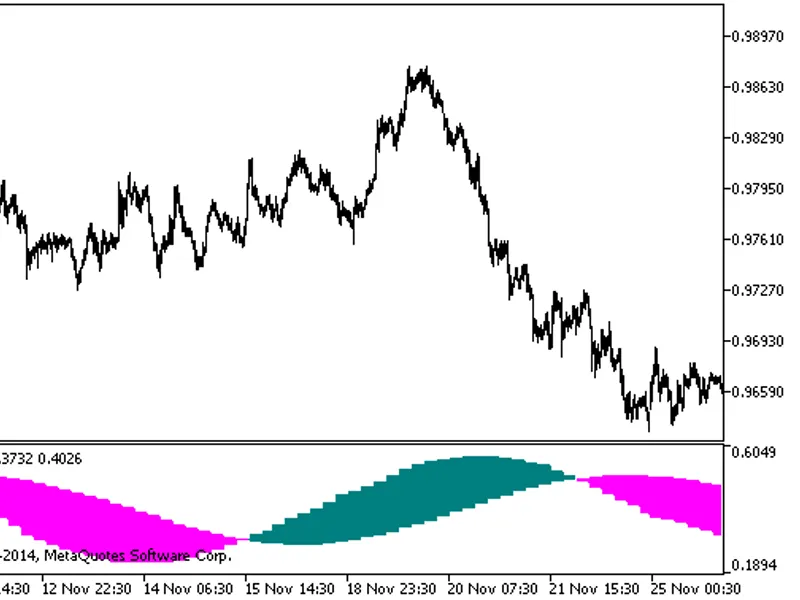
An axiom of technical analysis states that with few exceptions, all technical indicators can be classified as either trending or oscillating (non-trending) in their design. This new indicator, the Volume Zone Oscillator (VZO), addresses both. In his book Technical Analysis Of The Financial Markets, John J. Murphy explains that using oscillators provides three benefits:
Overbought and oversold conditions warn that price trend is overextended and vulnerable.
Divergence between oscillator and price action shows hidden strength or weakness in the market, which is not apparent in the price action.
The crossing of the zero line can give an important trading signal.
PS: to have trend determined on a sort of a dynamic zero line, use levels 50 for both up and down. In that case you shall have something like this: