Ultra Spearman Rank Correlation
This professional-grade solution for MetaTrader 5 helps traders achieve greater efficiency in their daily workflow. This technical indicator acts as a specialized analysis tool designed to visualize market data. It helps traders identify emerging trends, momentum shifts, and key support or resistance levels by plotting statistical calculations directly onto price charts.
How to Setup and Use Ultra Spearman Rank Correlation
1. Installation: Place your file in the MQL/Indicators folder via "Open Data Folder" and restart your terminal.
2. Loading: Find the indicator in the Navigator, drag it onto your chart, and configure the input parameters in the popup window.
3. Customization: Press Ctrl+I to open the indicator list, select your tool, and click "Properties" to change colors, levels, or visual styles.
4. Updating: Replace the old file in the Indicators folder with the new version and restart the platform to apply changes.
Frequently Asked Questions
Q: Why is my indicator not showing? A: Verify the file is in the MQL/Indicators folder, or try right-clicking the "Indicators" tree in the Navigator and clicking "Refresh."
Q: Do custom indicators slow down the platform? A: Too many complex indicators can impact performance; remove unused ones via the "Indicator List" (Ctrl+I).
Q: Can I use MT4 indicators on MT5? A: No, MQL4 and MQL5 are distinct languages; ensure the indicator is compiled specifically for your platform version.
Description & Settings
This indicator is based on values of the several signal lines of indicator. The signal lines calculation algorithm looks as follows. The input parameters contain
rangeN - averaging period;
The set of the signal lines is calculated using the arithmetic progression formula:
The value Number variable vary from 0 to StepsTotal. The resulting periods added to the arrays and used in calculation of the averaged values of indicator. The calculation of current trend direction is based on the averaged trend values for all signal lines.
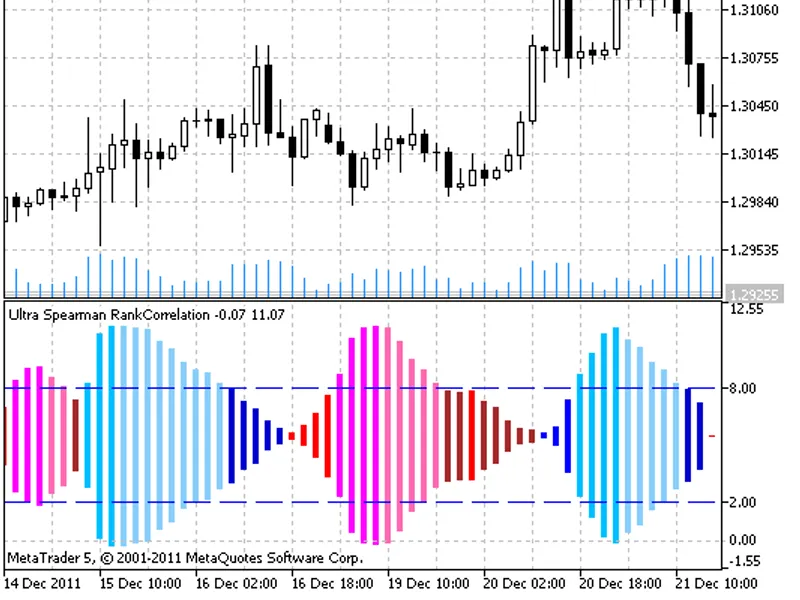
Finally, the positive and negative values of the trends are averaged and used as indicator lines, shown as a color histogram, plotted using the drawing style. Historgram color depends on trend direction, the histogram width depends on strength of the trend.
For indicator values outside the overbought and oversold levels the dark colors are used. For the overbought/oversold values the light colors are used.
Input parameters:
- simple moving average;
- exponential moving average;
- smoothed moving average;
- linear weighted moving average;
- JMA adaptive average;
- ultralinear smoothing;
- parabolic smoothing;
- Tillson's multiple exponential smoothing;
- smoothing with the use of Tushar Chande's algorithm;
- smoothing with the use of Perry Kaufman's algorithm.
It should be noted that Phase1 and Phase2 parameters have completely different meaning for different smoothing algorithms. For JMA it is an external Phase variable changing from -100 to +100. For T3 it is a smoothing ratio multiplied by 100 for better visualization, for VIDYA it is a CMO oscillator period and for AMA it is a slow EMA period. In other algorithms these parameters do not affect smoothing. For AMA fast EMA period is a fixed value and is equal to 2 by default. The ratio of raising to the power is also equal to 2 for AMA.
The indicator uses SmoothAlgorithms.mqh library classes (must be copied to the terminal_data_folder\MQL5\Include). The use of the classes was thoroughly described in the article .
The indicator uses SpearmanRankCorrelation.mq5 indicator, it must be placed to terminal_data_folder\MQL5\Include.
Ultra Spearman Rank Correlation indicator