Spearman's Rank Correlation
This software component for MetaTrader 4 is built to enhance the capabilities of your trading environment. This technical indicator acts as a specialized analysis tool designed to visualize market data. It helps traders identify emerging trends, momentum shifts, and key support or resistance levels by plotting statistical calculations directly onto price charts.
How to Setup and Use Spearman's Rank Correlation
1. Installation: Place your file in the MQL/Indicators folder via "Open Data Folder" and restart your terminal.
2. Loading: Find the indicator in the Navigator, drag it onto your chart, and configure the input parameters in the popup window.
3. Customization: Press Ctrl+I to open the indicator list, select your tool, and click "Properties" to change colors, levels, or visual styles.
4. Updating: Replace the old file in the Indicators folder with the new version and restart the platform to apply changes.
Frequently Asked Questions
Q: Why is my indicator not showing? A: Verify the file is in the MQL/Indicators folder, or try right-clicking the "Indicators" tree in the Navigator and clicking "Refresh."
Q: Do custom indicators slow down the platform? A: Too many complex indicators can impact performance; remove unused ones via the "Indicator List" (Ctrl+I).
Q: Can I use MT4 indicators on MT5? A: No, MQL4 and MQL5 are distinct languages; ensure the indicator is compiled specifically for your platform version.
Description & Settings
Spearman's Rank Correlation is a little less powerful than the Parametric Correlation.
It is reasonable to use the rank correlation when there is just a small amount of observations. This method can be used for both numerical data and in the cases, when the registered values are detected by attributes of various intensity. The source of the above description was found .
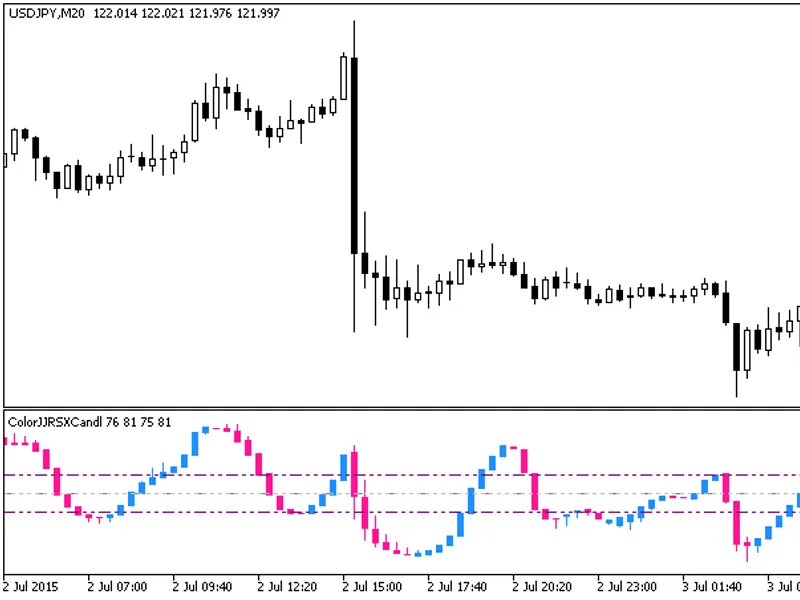
This indicator is one of oscillators. However, being compared to stochastic oscillator, it is smoother. Moreover, it does not delay in pivot points.
The only external parameter that influences the calculation algorithms is rangeN. It sets the amount of bars, for which we are trying to find regularities. If rangeN = 14, then we take the close price sequence Close[i], Close[i+1], ... Close[i+rangeN-1], and construct a rank sequence for them, i.e., we find the location of each close price when the sequence is sorted. In this case, one real chart turns to be compared to another, monotone increasing chart.
The parameter of direction means sorting from the highest to the lowest value (true) or from the lowest to the highest value (false). The value of true shows a more usual picture, whereas false produces an inverted image. Parameter CalculatedBars is introduced in order to limit the amount of bars under calculation, to save CPU resources (though that wasn't needed). Zero value of this parameter means that calculations will be performed for all history available. Parameter Maxrange = 30 sets the maximum calculation period. This parameter was introduced in order to save resources, as well, so maybe somebody will need it.