Ticks indicator
This is a powerful addition to your MetaTrader 5 toolkit designed to optimize market analysis and performance. This technical indicator acts as a specialized analysis tool designed to visualize market data. It helps traders identify emerging trends, momentum shifts, and key support or resistance levels by plotting statistical calculations directly onto price charts.
How to Setup and Use Ticks indicator
1. Installation: Place your file in the MQL/Indicators folder via "Open Data Folder" and restart your terminal.
2. Loading: Find the indicator in the Navigator, drag it onto your chart, and configure the input parameters in the popup window.
3. Customization: Press Ctrl+I to open the indicator list, select your tool, and click "Properties" to change colors, levels, or visual styles.
4. Updating: Replace the old file in the Indicators folder with the new version and restart the platform to apply changes.
Frequently Asked Questions
Q: Why is my indicator not showing? A: Verify the file is in the MQL/Indicators folder, or try right-clicking the "Indicators" tree in the Navigator and clicking "Refresh."
Q: Do custom indicators slow down the platform? A: Too many complex indicators can impact performance; remove unused ones via the "Indicator List" (Ctrl+I).
Q: Can I use MT4 indicators on MT5? A: No, MQL4 and MQL5 are distinct languages; ensure the indicator is compiled specifically for your platform version.
Description & Settings
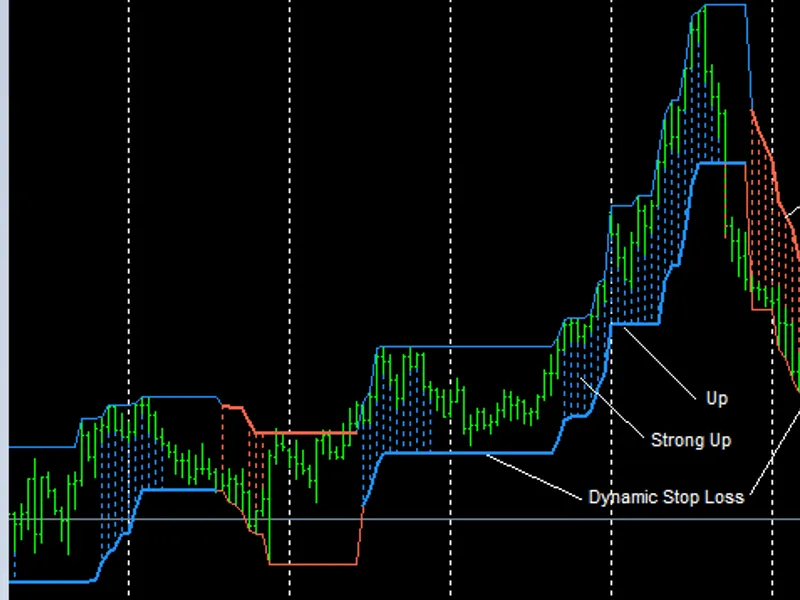
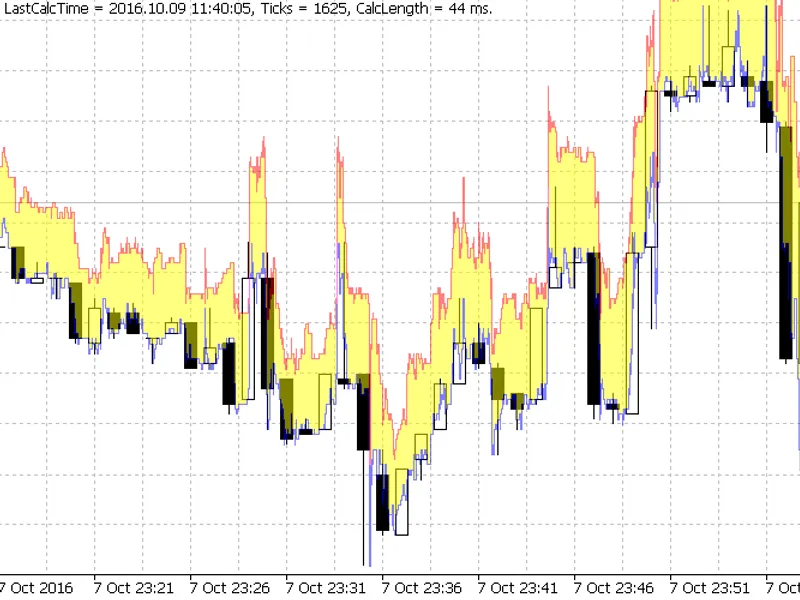
Differs from other tick indicators in that it shows the history on the main chart directly over the bars. The "spread" history is clearly visible, as well as formation process of each bar. Visually shows the formation of the current real-time bar.
Warning
As the indicator shows the price tick history for all time interval visible on the chart, the number of ticks for visualization may count up to hundreds of thousands and millions. Such heavy load causes the indicator to work slowly. For example, at the minimum scale on the H1, the visible interval may reach several months. The indicator will work very slowly, in order to load and display many millions of ticks.
If you are going to monitor ticks, it is logical to use a small TF (up to M5) and a large scale, in order to be able to see the price history in details (as in the figure above).
The indicator was taken from the and slightly modified — it had array overflows. Added (several lines) filling the area between the corresponding LowAsk and HighBid. Much of the excess was removed from the original — OOP construction of the indicator and unused mqh-files.
It is surprisingly (has no indicator buffers at all) stable.
Its design is far from optimal. Apparently, this is due to the fact that many bugs in the CopyTicks function had not been fixed yet at the time it was written. However, it shows the history data correctly and quite quickly (there is room for increasing the speed significantly).
Addressing this indicator via iCustom and IndicatorCreate is meaningless — there are no indicator buffers. It only serves for history visualization. And it is actually designed as an indicator only due to a certain coincidence of the main function — to show.
For example, the same as an EA
That is, it simply uses one of the custom types of interactive graphical objects. Therefore, paradoxically, this indicator is only formally an indicator — the technical form of MT program.
The transparency level for this object can be set in the input parameters.
The indicator is self-sufficient, it does not use standard libraries.
Making a screenshot using the terminal means is problematic — it may not match what the terminal shows.
Complies for MetaTrader 4, but of course, it does not show anything (no CopyTicks data).