
welch candlesticks
Info
The welch candlesticks is a Indicator for MetaTrader 4 that real tim welch the basic candlesticks that are built into metatrader 4 have a rudimentary, and potentially devastating flaw. they never show you the ask line, and, they never save that ask price in the history.
Usage
This tool is typically used for enhancing chart analysis and decision making.
Platform
This Indicator works exclusively on MetaTrader 4 (both build 600+ and newer versions).
Setup
Place the downloaded file in MQL4/Indicators folder via File ? Open Data Folder in MetaTrader 4.
How to Install and Use welch candlesticks
1. Installation: Place your file in the MQL/Indicators folder via "Open Data Folder" and restart your terminal.
2. Loading: Find the indicator in the Navigator, drag it onto your chart, and configure the input parameters in the popup window.
3. Customization: Press Ctrl+I to open the indicator list, select your tool, and click "Properties" to change colors, levels, or visual styles.
4. Updating: Replace the old file in the Indicators folder with the new version and restart the platform to apply changes.
Frequently Asked Questions
Q: Why is my indicator not showing? A: Verify the file is in the MQL/Indicators folder, or try right-clicking the "Indicators" tree in the Navigator and clicking "Refresh."
Q: Do custom indicators slow down the platform? A: Too many complex indicators can impact performance; remove unused ones via the "Indicator List" (Ctrl+I).
Q: Can I use MT4 indicators on MT5? A: No, MQL4 and MQL5 are distinct languages; ensure the indicator is compiled specifically for your platform version.
What this tool does
real tim welch the basic candlesticks that are built into metatrader 4 have a rudimentary, and potentially devastating flaw.
Typical Use Case
This Indicator excels in automated trading and technical analysis on MetaTrader 4.
Compatible Platform & Setup
This Indicator works on MetaTrader 4. Place the file in the MQL4/Indicators folder and restart the terminal.
Description & Settings
Related: Welch Bollinger Band Width - another powerful indicator for MetaTrader 4 traders.
real
tim welch
the basic candlesticks that are built into metatrader 4 have a rudimentary, and potentially devastating flaw. they never show you the ask line, and, they never save that ask price in the history. this situation can be compounded when/if a broker chooses to send the bid data through to your metatrader 4 as an "averaged price" calculated by averaging bid and ask together. i know of one such broker who does this, so i can imagine that there are more than just one.
Also recommended: candlesticks bw - similar indicator with strong performance on MetaTrader 4.
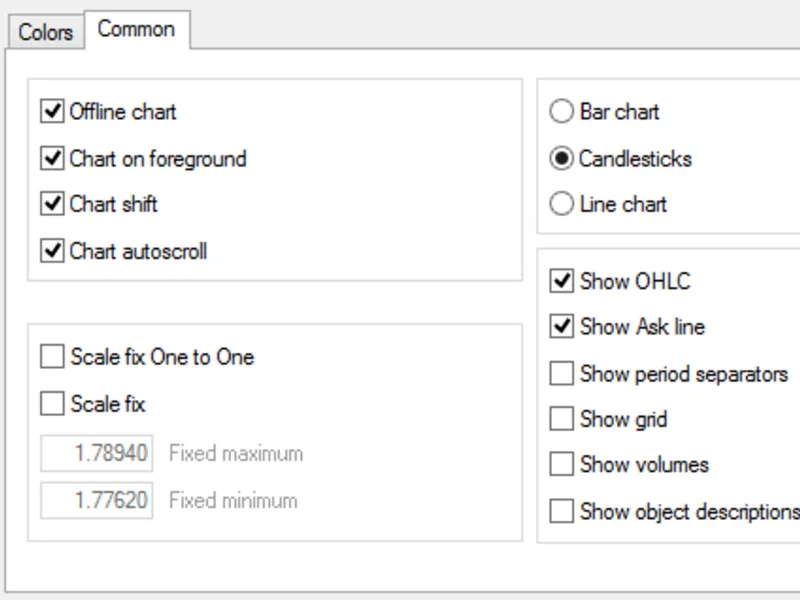
in metatrader 4 the calculation of candlesticks is based on bid data, to see the current ask price you need to check "show ask line" in the chart properties. it's important to see the ask prices when placing stop loss.
to see the situation in a live chart, and for full effect i recommend opening up a 1m chart: open up a blank chart -> open chart properties -> change the chart style to candlesticks -> and then make sure you have the "show ask lines" activated.
you will immediately see a red line pop up on the chart. watch this red line, it will have no affect whatsoever on the building of the candlesticks unless/until someone actually buys at the ask price.
this ask price is valuable in determining a stop loss. if you see the ask price consistently above (or as in a time of spread increase, way above) the price historically, you can more accurately place your stop loss when making a new trade.
how to remedy this? well, unfortunately, there is no way to remedy this for the past without creating offline charts with the data included, because the historical data on a chart does not save the ask, only the bid.
but, there is a way to remedy this on a live chart. the first way is the way i already showed you. the second way is to where welchcandlesticks_v2 comes into play.
when you add this indicator to the chart, it will build all new candlesticks with the spread data included as part of the wicks for the candlesticks. this doesn't affect open/close/low, only high. (bid is always the low, so it doesn't affect that, which is why i was only getting stop lossed out of my sell trades, because they would reverse and the spread would rise higher and take me out before i could see it happening and close my positions... the automated way to fix this for when you're not watching the chart is to always watch the ask price and calculate the spread and what-not, but i wanted to visually see when i was cut out of a trade so i could better understand why...)
below you will see 2 charts. one with normal candlesticks and one overlaid with my candlesticks. you should be able to spot the lime lines pretty easily, which is where the spread goes above what the candlestick high would have told you...
this is from audjpy today (2014/08/25)
and one more chart showing an enormous spread spike a while back just before the price went further down...
i've been using this for the past few years now with good success. it's just something that i've found gives me a slight edge in the grand scheme of things. it's not an overnight money maker, by any means, and in fact it won't make you money at all! but it should at least help you to visually see when your broker is changing the spread because now it's being reflected in the candlestick formation, which you can use to more accurately place your stops and not get kicked out of a trade when it might just be challenging a price before making a huge swing in the direction you initially placed your trade. :-)
You may also like: basing candlesticks mt4 - excellent alternative for indicator users on MetaTrader 4.
Source Code
#property copyright "robotfx"
#property link "https://robotfx.org"
#property indicator_chart_window
#property indicator_buffers 8
#property indicator_color1 tomato
#property indicator_color2 white
#property indicator_color3 tomato
#property indicator_color4 white
#property indicator_color5 lime
#property indicator_color6 lime
.......
⚠ Limitations & Risk Warning
- This tool is provided for educational and testing purposes only.
- Past performance does not guarantee future results.
- Trading involves substantial risk of loss. Use on a demo account first.
- Results may vary depending on market conditions, broker, and settings.
- We recommend thorough backtesting and forward testing before using with real funds.