Welch Bollinger Band ® Width
This is a powerful addition to your MetaTrader 4 toolkit designed to optimize market analysis and performance. This technical indicator acts as a specialized analysis tool designed to visualize market data. It helps traders identify emerging trends, momentum shifts, and key support or resistance levels by plotting statistical calculations directly onto price charts.
How to Setup and Use Welch Bollinger Band ® Width
1. Installation: Place your file in the MQL/Indicators folder via "Open Data Folder" and restart your terminal.
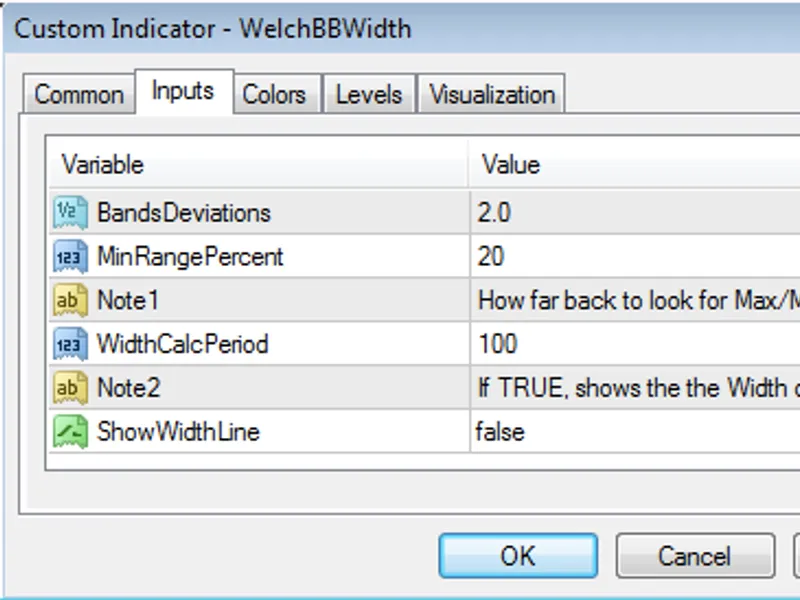
2. Loading: Find the indicator in the Navigator, drag it onto your chart, and configure the input parameters in the popup window.
3. Customization: Press Ctrl+I to open the indicator list, select your tool, and click "Properties" to change colors, levels, or visual styles.
4. Updating: Replace the old file in the Indicators folder with the new version and restart the platform to apply changes.
Frequently Asked Questions
Q: Why is my indicator not showing? A: Verify the file is in the MQL/Indicators folder, or try right-clicking the "Indicators" tree in the Navigator and clicking "Refresh."
Q: Do custom indicators slow down the platform? A: Too many complex indicators can impact performance; remove unused ones via the "Indicator List" (Ctrl+I).
Q: Can I use MT4 indicators on MT5? A: No, MQL4 and MQL5 are distinct languages; ensure the indicator is compiled specifically for your platform version.
Description & Settings
maj1es2tic (Tim Welch)
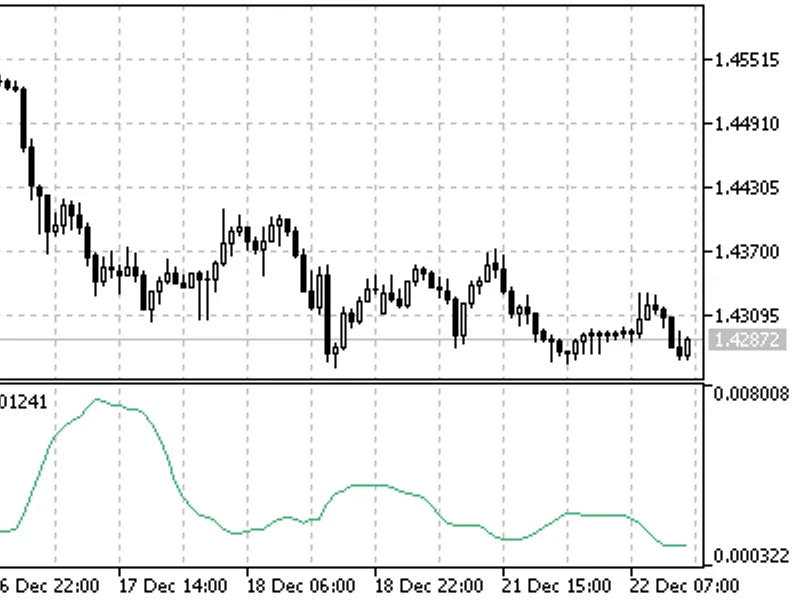
This indicator takes the current Width of the Bollinger Bands and compares it to the Maximum and Minimum Width of the Bollinger Bands over N periods (WidthCalcPeriod).
If the calculated percentage is less than or equal to MinRangePercent, then the histogram shows Green. If the calculated percentage is 2x the MinRangePercent, then the histogram shows Yellow. If neither of those match, the histogram shows Red.
This works out well to quickly see if the currency pair is ranging, or about to break out of range. If you set ShowWidthLine to true, then it will also show a line with the actual width of the Bollinger Bands in PIPS. This should work for 4 and 5 digit brokers and it works on all currency pairs.
Using iCustom to pull out values for an Expert Advisor or other Custom Indicators:
You should be able to pull out any of the values externally using the following code:
You could put something like this in your Expert Advisor:
** Use any/all code at your own discretion, and only place real trades when you have confirmation of other indicators. **
Image:
*NOTE: The dark grey vertical lines and red arrows were added to show the correlation of the indicator to the bollinger bands on the chart and they will NOT show up on your chart.
Enjoy!
-Tim