Ticks Volume Indicator 1. 1
This software component for MetaTrader 4 is built to enhance the capabilities of your trading environment. This technical indicator acts as a specialized analysis tool designed to visualize market data. It helps traders identify emerging trends, momentum shifts, and key support or resistance levels by plotting statistical calculations directly onto price charts.
How to Setup and Use Ticks Volume Indicator 1. 1
1. Installation: Place your file in the MQL/Indicators folder via "Open Data Folder" and restart your terminal.
2. Loading: Find the indicator in the Navigator, drag it onto your chart, and configure the input parameters in the popup window.
3. Customization: Press Ctrl+I to open the indicator list, select your tool, and click "Properties" to change colors, levels, or visual styles.
4. Updating: Replace the old file in the Indicators folder with the new version and restart the platform to apply changes.
Frequently Asked Questions
Q: Why is my indicator not showing? A: Verify the file is in the MQL/Indicators folder, or try right-clicking the "Indicators" tree in the Navigator and clicking "Refresh."
Q: Do custom indicators slow down the platform? A: Too many complex indicators can impact performance; remove unused ones via the "Indicator List" (Ctrl+I).
Q: Can I use MT4 indicators on MT5? A: No, MQL4 and MQL5 are distinct languages; ensure the indicator is compiled specifically for your platform version.
Description & Settings
Profitrader, improvement by Tor.
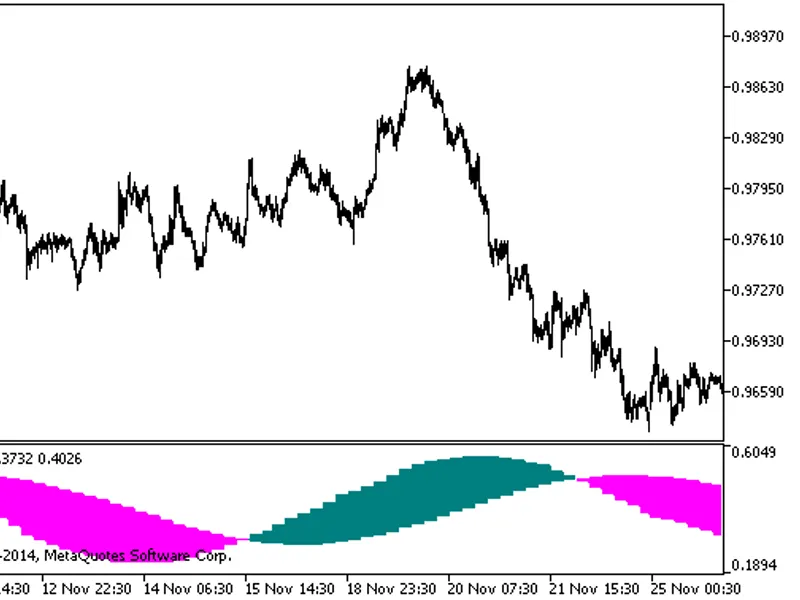
In the futures markets the data on trade volumes is reported with a one-day delay. To compensate for this, many analysts use the tick volume indicator (tick volume™): it allows you to track volume changes during the trading day.
Tick volume indicates the number of deals concluded over a certain intraday period, but does not show the number of contracts per deal. Thus, it can make, for example, 50 deals per hour. But the number of contracts concluded for each deal is not clear from this figure. There could be, for example, 50 one-lot orders or 50 hundred-lot orders. From this point of view, the tick volume does not reflect the true volume. However, it is still a valuable indicator because it is the only one that allows you to measure the volume with less delay, although at the expense of accuracy.
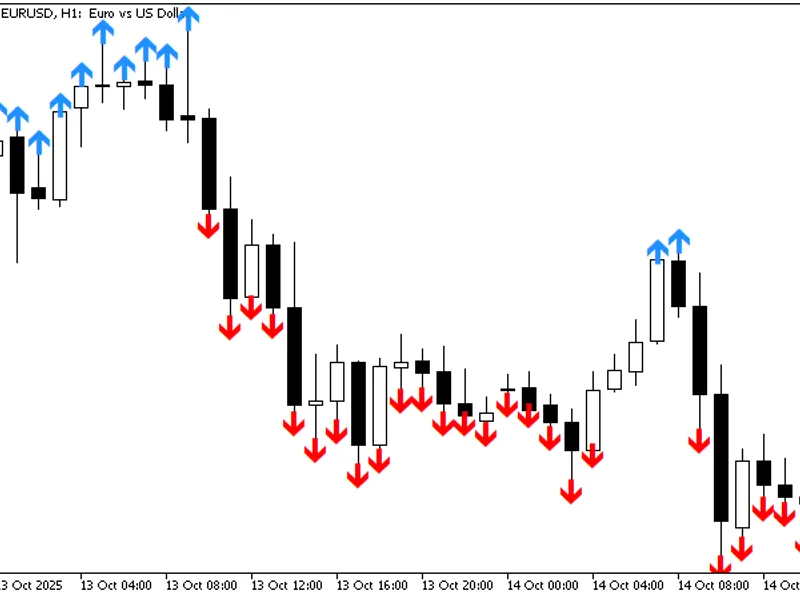
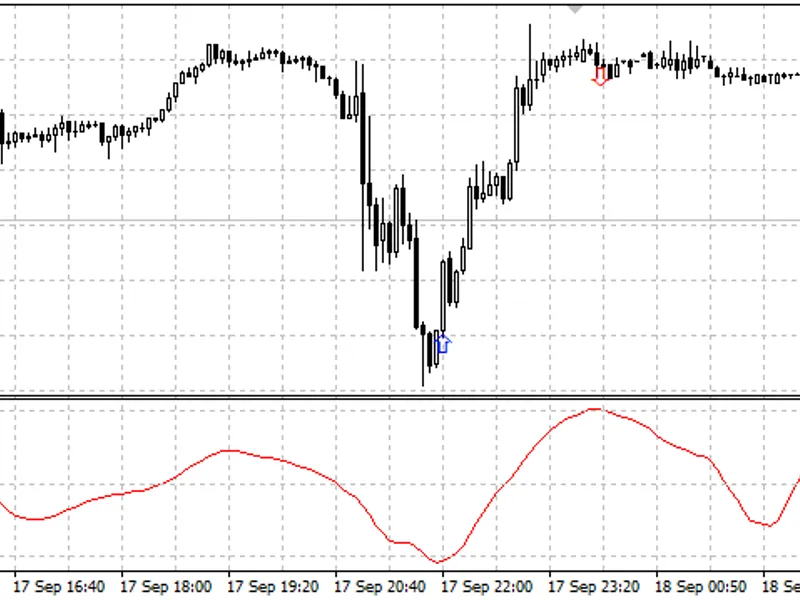
This is the main information on the indicator, I had tinkered with it in many ways and found out how to use it. Because of this, Alerts and drawing arrows on the chart were added to signal the user about the possible entries.
Hints:
It can be used on the major currencies like this: turn on the
М5
chart, then the indicator levels are
levelUP
= 4 and
levelDOWN
= -4, buy or sell according to them. It is recommended not to go against the trend too much, but in fact a lot of the signals turn out to be against the trend — the so-called corrections, and the indicator also determines the reversals. This can be seen on a history backtest.
For instance, to work with gold — XAUUSD — then on its M5 chart:
levelUP
= 40 and
levelDOWN
= -40 (the usual *10).
For the different timeframes the levels are individual. Using MM and averaging makes this a good system. Enter against the trend with caution.
Variables: