Ticks collector
This tool for MetaTrader 4 is specifically engineered to streamline your trading operations. This technical indicator acts as a specialized analysis tool designed to visualize market data. It helps traders identify emerging trends, momentum shifts, and key support or resistance levels by plotting statistical calculations directly onto price charts.
How to Setup and Use Ticks collector
1. Installation: Place your file in the MQL/Indicators folder via "Open Data Folder" and restart your terminal.
2. Loading: Find the indicator in the Navigator, drag it onto your chart, and configure the input parameters in the popup window.
3. Customization: Press Ctrl+I to open the indicator list, select your tool, and click "Properties" to change colors, levels, or visual styles.
4. Updating: Replace the old file in the Indicators folder with the new version and restart the platform to apply changes.
Frequently Asked Questions
Q: Why is my indicator not showing? A: Verify the file is in the MQL/Indicators folder, or try right-clicking the "Indicators" tree in the Navigator and clicking "Refresh."
Q: Do custom indicators slow down the platform? A: Too many complex indicators can impact performance; remove unused ones via the "Indicator List" (Ctrl+I).
Q: Can I use MT4 indicators on MT5? A: No, MQL4 and MQL5 are distinct languages; ensure the indicator is compiled specifically for your platform version.
Description & Settings
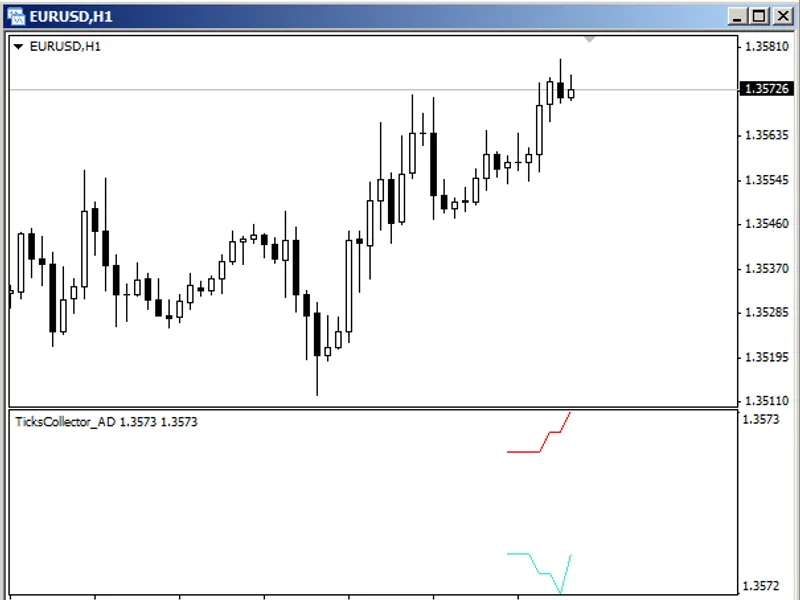
When working real-time the indicator collects price data: the tick arrival time, the Bid price and the Ask price. The Bid and Ask prices are displayed as lines in the indicator subwindow, and all the gathered information can be saved to a special tick file (tks file type).
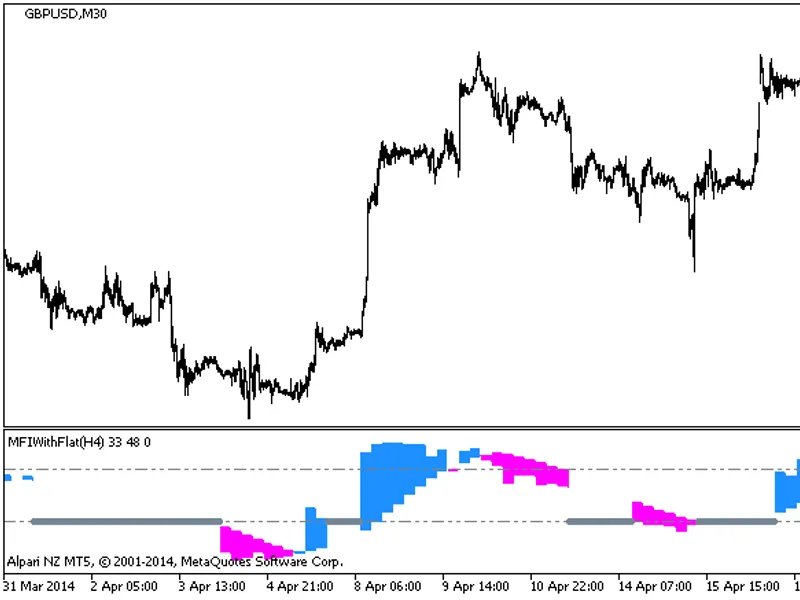
Along with the information collection, the indicator can plot and keep the non-standard charts active:
Isochronous charts with period from 1 second.
Range bar charts
Equivolume charts.For each of the listed chart types a specific price type can be set:
By Bid prices - the way it is used in МТ4.
By Ask prices - instead of Bid the real Ask prices are displayed, but not the addition of the spread value to the Bid price.
Close - min Bid, open - max Ask - the first combined price representation. Such chart shows the maximum distance the market went in the direction of the profit of the perfect deal - opening in the right direction by one of the candlestick prices.
Close - max Ask, open - min Bid - the second combined price representation. The chart displays the maximum amplitude of the prices on a candlestick.
The detailed description - .