







Support/Resistance and Fair Value Gap Zones
Info
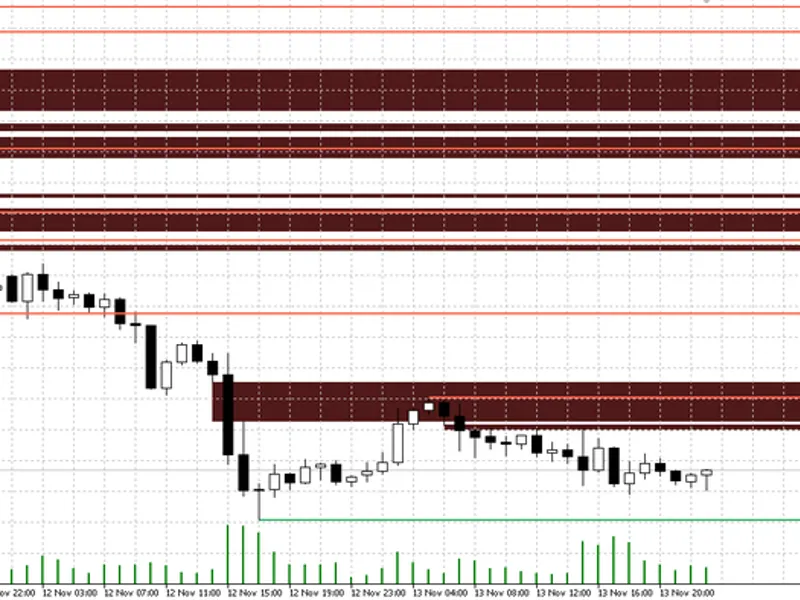
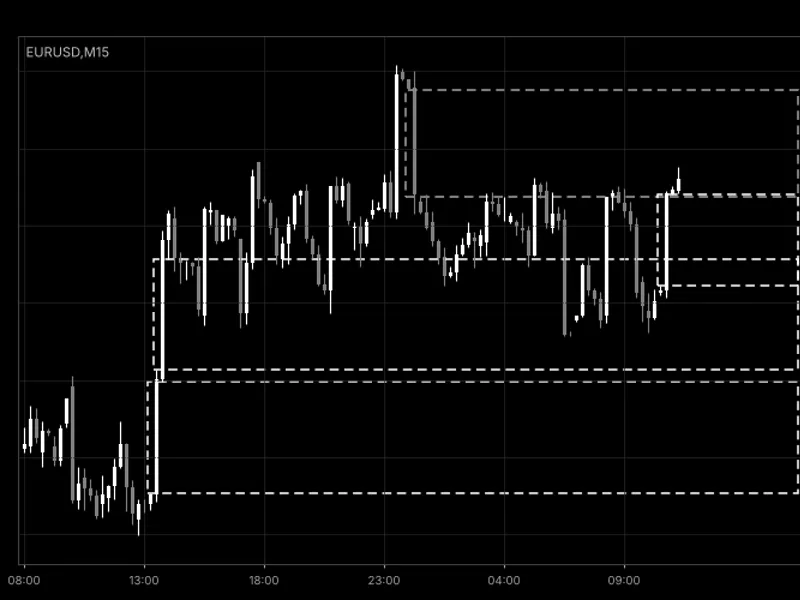
The Support/Resistance and Fair Value Gap Zones is a Indicator for MetaTrader 5 that this indicator draws two types of objects on the main chart based on fixed rules, ensuring consistent results for all traders. Support and ResistanceA support or resistance level is defined by a confirmed swing high or swing low.
Usage
This tool is typically used for enhancing chart analysis and decision making.
Platform
This Indicator works exclusively on MetaTrader 5 (both build 600+ and newer versions).
Setup
Place the downloaded file in MQL5/Indicators folder via File ? Open Data Folder in MetaTrader 5.
How to Install and Use Support/Resistance and Fair Value Gap Zones
1. Installation: Place your file in the MQL/Indicators folder via "Open Data Folder" and restart your terminal.
2. Loading: Find the indicator in the Navigator, drag it onto your chart, and configure the input parameters in the popup window.
3. Customization: Press Ctrl+I to open the indicator list, select your tool, and click "Properties" to change colors, levels, or visual styles.
4. Updating: Replace the old file in the Indicators folder with the new version and restart the platform to apply changes.
Frequently Asked Questions
Q: Why is my indicator not showing? A: Verify the file is in the MQL/Indicators folder, or try right-clicking the "Indicators" tree in the Navigator and clicking "Refresh."
Q: Do custom indicators slow down the platform? A: Too many complex indicators can impact performance; remove unused ones via the "Indicator List" (Ctrl+I).
Q: Can I use MT4 indicators on MT5? A: No, MQL4 and MQL5 are distinct languages; ensure the indicator is compiled specifically for your platform version.
What this tool does
This indicator draws two types of objects on the main chart based on fixed rules, ensuring consistent results for all traders.
Typical Use Case
This Indicator excels in automated trading and technical analysis on MetaTrader 5.
Compatible Platform & Setup
This Indicator works on MetaTrader 5. Place the file in the MQL5/Indicators folder and restart the terminal.
Description & Settings
Related: Fair Value Gap (FVG) Detector with Auto-Removal When Filled (2026 Update) - another powerful indicator for MetaTrader 5 traders.
This indicator draws two types of objects on the main chart based on fixed rules, ensuring consistent results for all traders.Also recommended: Fair Value Gap (FVG) Detector with Auto-Removal - similar indicator with strong performance on MetaTrader 5.
Support and Resistance
A support or resistance level is defined by a confirmed swing high or swing low. The high (or low) of a bar must be the extreme point within the `InpPivotLen` bars on either side. A pivot is confirmed only `InpPivotLen` bars after its formation and remains fixed thereafter. The indicator scans from the most recent pivot backward in time. A new level is disregarded if it is closer than `InpMergeATR` multiplied by the Average True Range (ATR) to an existing level, effectively merging clusters of nearby swings into a single line. Levels above the current price are displayed in the resistance color, and levels below are shown in the support color, with colors updating on every tick.
Fair Value Gaps
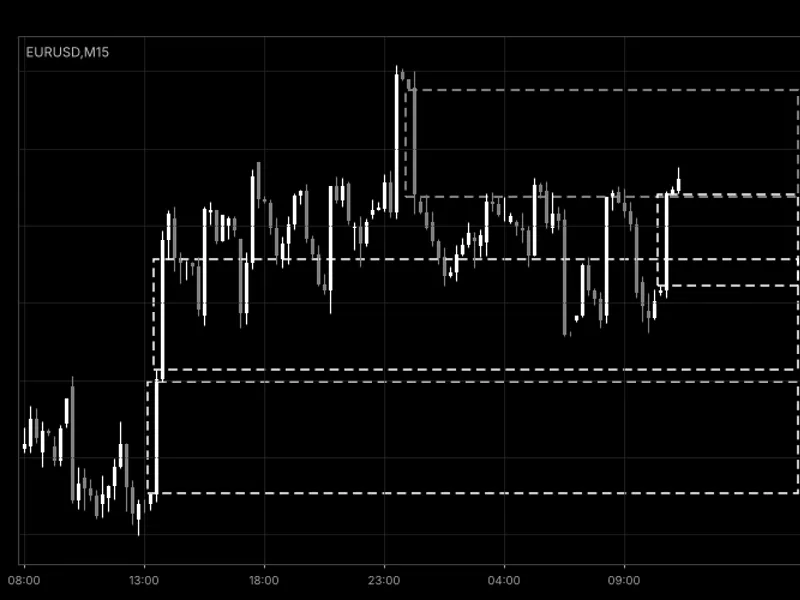
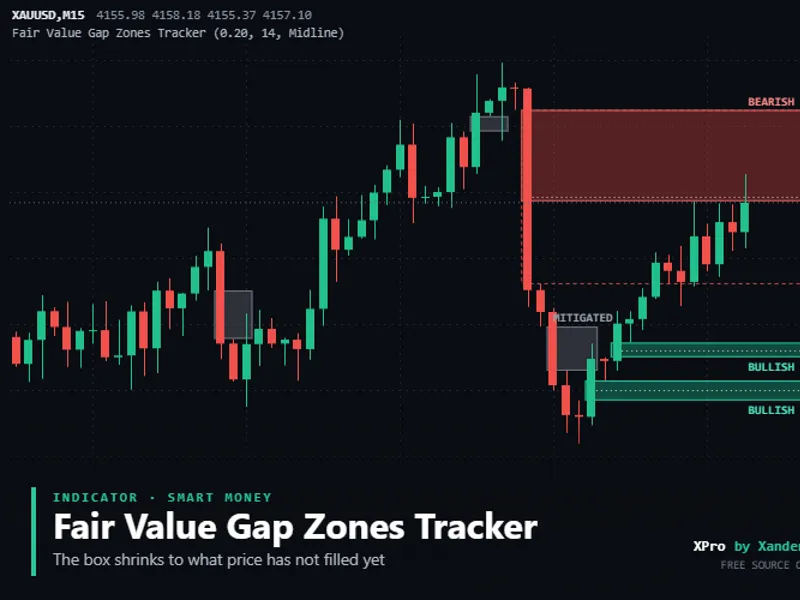
A bullish gap occurs when the low of a bar is higher than the high of the bar two positions prior. A bearish gap occurs when the high of a bar is lower than the low of the bar two positions prior. Gaps smaller than `InpMinGapATR` multiplied by ATR are ignored. A gap is visualized as a rectangle extending from its initial bar to the right edge of the chart. It is removed once any subsequent bar trades back into the far side of the gap (i.e., the low is at or below the gap's bottom for a bullish gap, or the high is at or above the gap's top for a bearish gap). Only the most recent `InpMaxGaps` open gaps are displayed.
The indicator recalculates once per new bar, making it efficient even on M1 charts. It uses no buffers and creates only chart objects prefixed with SRFVG_, which are deleted when the indicator is removed.
Inputs
InpPivotLen
(10) – The number of bars on each side that a swing high/low must dominate. Larger values identify only major levels.
InpMaxLevels
(8) – The maximum number of support/resistance lines to display.
InpMergeATR
(0.5) – Levels closer than this multiple of ATR are merged into one.
InpMinGapATR
(0.1) – The minimum gap size, expressed as a multiple of ATR.
InpMaxGaps
(15) – The maximum number of open gaps to be drawn.
InpLookback
(1500) – The number of bars to scan for levels and gaps.
InpAtrPeriod
(14) – The period for the ATR calculation, used for merging levels and determining minimum gap size.
Colours
– Options to set the colors for resistance, support, bullish gaps, and bearish gaps.
The identified levels and gaps represent a historical description of price structure, not direct trading signals. A practical application involves exporting these zones into an Expert Advisor's logic for testing in the Strategy Tester to determine if reactions within these zones perform better than random price points on a specific symbol and timeframe. This analysis can be conducted in 2026.
You may also like: Fair Value Gap Zones Tracker - excellent alternative for indicator users on MetaTrader 5.
Source Code
#property copyright "RobotFX"
#property version   "1.00"
#property description "This code is educational. Feel free to use, modify and upgrade as you wish. Visit ROBOTFX.ORG for professional trading tools"
#property indicator_chart_window
#property indicator_buffers 0
#property indicator_plots   0
input int    InpPivotLen   = 10;
input int    InpMaxLevels  = 8;
input double InpMergeATR   = 0.5;
input double InpMinGapATR  = 0.1;
.......
⚠ Limitations & Risk Warning
- This tool is provided for educational and testing purposes only.
- Past performance does not guarantee future results.
- Trading involves substantial risk of loss. Use on a demo account first.
- Results may vary depending on market conditions, broker, and settings.
- We recommend thorough backtesting and forward testing before using with real funds.