
Session Volatility Heatmap
Info
The Session Volatility Heatmap is a Indicator for MetaTrader 5 that session volatility heatmapthe idea behind itmost traders are familiar with the standard session times, but each symbol has its unique trading rhythm. The hour when a symbol becomes active may not always align with the times indicated in session guides.
Usage
This tool is typically used for enhancing chart analysis and decision making.
Platform
This Indicator works exclusively on MetaTrader 5 (both build 600+ and newer versions).
Setup
Place the downloaded file in MQL5/Indicators folder via File ? Open Data Folder in MetaTrader 5.
How to Install and Use Session Volatility Heatmap
1. Installation: Place your file in the MQL/Indicators folder via "Open Data Folder" and restart your terminal.
2. Loading: Find the indicator in the Navigator, drag it onto your chart, and configure the input parameters in the popup window.
3. Customization: Press Ctrl+I to open the indicator list, select your tool, and click "Properties" to change colors, levels, or visual styles.
4. Updating: Replace the old file in the Indicators folder with the new version and restart the platform to apply changes.
Frequently Asked Questions
Q: Why is my indicator not showing? A: Verify the file is in the MQL/Indicators folder, or try right-clicking the "Indicators" tree in the Navigator and clicking "Refresh."
Q: Do custom indicators slow down the platform? A: Too many complex indicators can impact performance; remove unused ones via the "Indicator List" (Ctrl+I).
Q: Can I use MT4 indicators on MT5? A: No, MQL4 and MQL5 are distinct languages; ensure the indicator is compiled specifically for your platform version.
What this tool does
Session Volatility HeatmapThe Idea Behind ItMost traders are familiar with the standard session times, but each symbol has its unique trading rhythm.
Typical Use Case
This Indicator excels in automated trading and technical analysis on MetaTrader 5.
Compatible Platform & Setup
This Indicator works on MetaTrader 5. Place the file in the MQL5/Indicators folder and restart the terminal.
Description & Settings
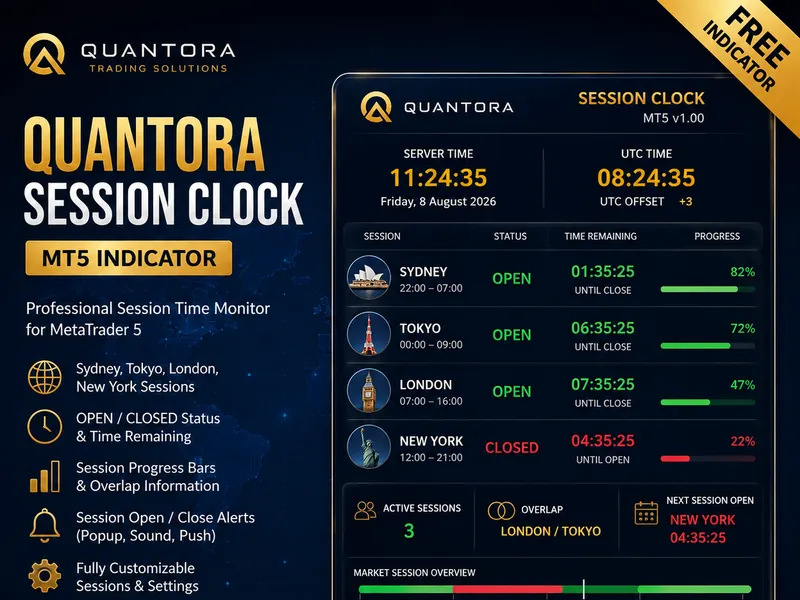
Related: Quantora Session Clock MT5 - Professional Forex Trading Session Monitor - another powerful indicator for MetaTrader 5 traders.
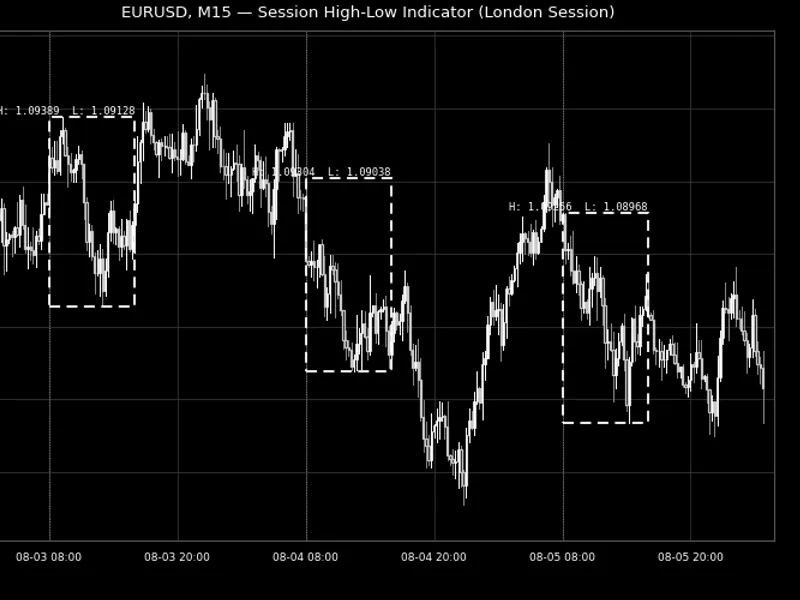
Session Volatility HeatmapAlso recommended: Session High-Low Indicator for MetaTrader - similar indicator with strong performance on MetaTrader 5.
The Idea Behind It
Most traders are familiar with the standard session times, but each symbol has its unique trading rhythm. The hour when a symbol becomes active may not always align with the times indicated in session guides. This indicator replaces guesswork with precise measurements. It analyzes a specified number of historical days (
InpLookbackDays
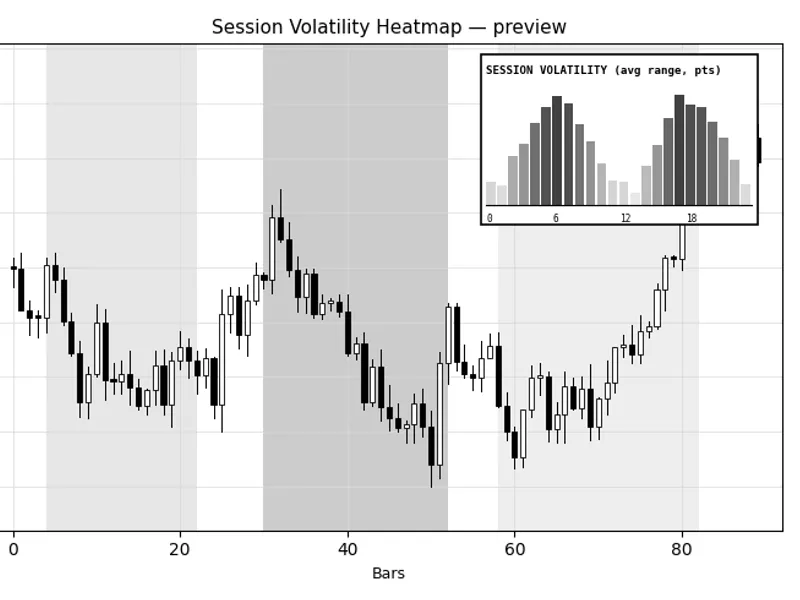
) on the chart's native timeframe. Each bar's range (high - low) is categorized by the hour in which it closed, and the average range for each of the 24 hourly buckets is calculated. The outcome is presented as a compact heatmap panel. Concurrently, the three major trading sessions are highlighted with colored shading directly behind the price candles, allowing for immediate visual comparison between the two views.
How to Interpret It
The Heatmap Bars
Each of the 24 columns represents one hour of the broker/server day. Taller columns with warmer colors indicate hours where the specific symbol has historically experienced greater movement. Conversely, short columns with cooler colors signify quieter periods. Since the calculation is based on your own historical data, it accurately reflects the behavior of this symbol on your broker's server time, rather than a generic session chart.
The Session Bands
The pale shaded rectangles behind the price action denote the Asian, London, and New York trading sessions for each of the last
InpSessionDays
days. Areas where two bands overlap represent the periods of highest liquidity during the day. A visual comparison of these overlaps with the heatmap panel typically confirms that these periods also correspond to the hours with the tallest bars.
Reading Both Views Together
The heatmap reveals which hour has historically been most volatile, while the session bands provide context for why. If the tallest bar in the heatmap does not align with a session overlap for your instrument, this observation is significant. It often indicates that a scheduled event (such as a market open, fix, or recurring data release) is influencing that hour's activity, rather than typical session flows.
This tool is designed for measurement, not for generating trading signals. It does not suggest specific entry or exit points. Its purpose is solely to illustrate where historical volatility and liquidity are concentrated, enabling traders to make informed decisions about optimal trading times or periods to abstain from trading based on measured data rather than assumptions.
External Variables (Inputs)
Input
Default
Purpose
InpLookbackDays
30
Specifies the number of historical days used to calculate the hourly averages. Longer lookback periods smooth out anomalies caused by one-off news events, while shorter periods allow for quicker adaptation to genuine changes in the symbol's trading rhythm.
InpCorner / InpOffsetX / InpOffsetY
Right Upper / 12 / 18
Determines the position of the heatmap panel on the chart.
InpPanelWidth / InpPanelHeight
340 / 150
Sets the dimensions of the panel in pixels.
InpRefreshSecs
30
Defines how frequently the panel recalculates its data based on historical information, independent of incoming ticks.
InpShowSessions
true
Toggles the display of session background shading on the price chart.
InpSessionDays
6
Sets the number of recent days to be shaded. This is kept at a modest value by default to prevent excessive clutter on the chart with graphical objects.
InpAsianStartHour / InpAsianEndHour
0 / 9
Defines the start and end hours for the Asian trading session, based on broker/server time.
InpLondonStartHour / InpLondonEndHour
7 / 16
Defines the start and end hours for the London trading session, based on broker/server time.
InpNewYorkStartHour / InpNewYorkEndHour
12 / 21
Defines the start and end hours for the New York trading session, based on broker/server time.
InpBackColor / InpBorderColor / InpTextColor
see code
Configures the color scheme for the heatmap panel.
InpLowColor / InpHighColor
see code
Sets the two extreme colors used for interpolating the heatmap, ranging from the least active to the most active hours.
InpAsianBandColor / InpLondonBandColor / InpNewYorkBandColor
pale blue / amber / red
Specifies the colors used for shading the trading sessions. These are set to pale values by default because chart rectangle objects render with full opacity, lacking true transparency. Therefore, the colors themselves must be kept soft.
Recommended Use
It is crucial to verify your broker's server time relative to UTC, as each broker's clock is set differently. Before relying on the default session hours, confirm your broker's actual server time. While these defaults represent typical starting points, they are not universally fixed. Once the three session ranges are accurately configured for your specific broker, the panel and shading will remain consistent without further adjustments.
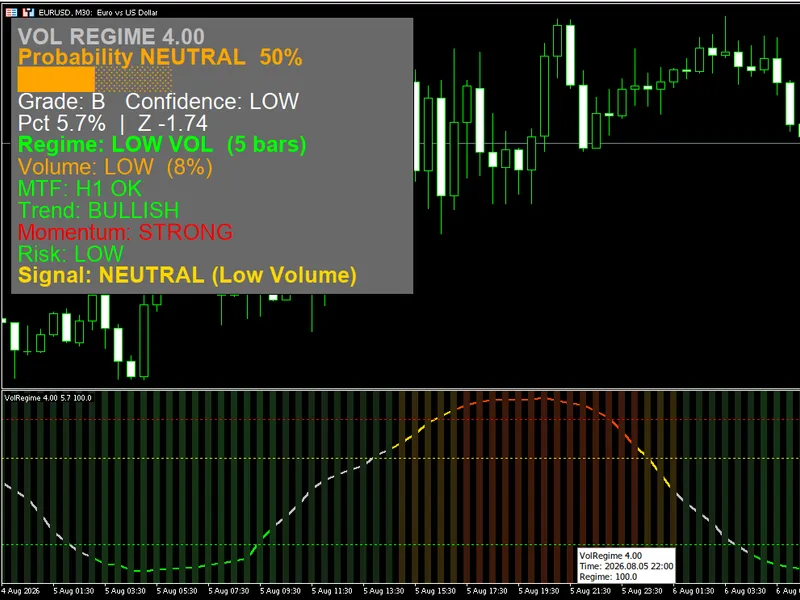
Fig. 1. The hourly volatility heatmap panel displayed alongside session-shaded price candles. The visualization is presented in black and white, adhering to the Code Base image guidelines. (Image rendered circa 2026)
You may also like: Volatility Regime Indicator - excellent alternative for indicator users on MetaTrader 5.
Source Code
#property copyright "RobotFX"
#property link "https://robotfx.org"
#property version   "1.00"
#property strict
#property indicator_chart_window
#property indicator_buffers 0
#property indicator_plots   0
#include <Canvas\Canvas.mqh>
input group "=== Volatility Heatmap ==="
input int    InpLookbackDays   = 30;
.......
⚠ Limitations & Risk Warning
- This tool is provided for educational and testing purposes only.
- Past performance does not guarantee future results.
- Trading involves substantial risk of loss. Use on a demo account first.
- Results may vary depending on market conditions, broker, and settings.
- We recommend thorough backtesting and forward testing before using with real funds.