





Relative Volume (RVOL) Indicator in a Subwindow
Info
The Relative Volume (RVOL) Indicator in a Subwindow is a Indicator for MetaTrader 5 that relative volume (rvol) indicator in a subwindowthe idea behind itraw volume bars are difficult to interpret. It is hard to determine if 1,800 ticks is a large or small amount without context.
Usage
This tool is typically used for enhancing chart analysis and decision making.
Platform
This Indicator works exclusively on MetaTrader 5 (both build 600+ and newer versions).
Setup
Place the downloaded file in MQL5/Indicators folder via File ? Open Data Folder in MetaTrader 5.
How to Install and Use Relative Volume (RVOL) Indicator in a Subwindow
1. Installation: Place your file in the MQL/Indicators folder via "Open Data Folder" and restart your terminal.
2. Loading: Find the indicator in the Navigator, drag it onto your chart, and configure the input parameters in the popup window.
3. Customization: Press Ctrl+I to open the indicator list, select your tool, and click "Properties" to change colors, levels, or visual styles.
4. Updating: Replace the old file in the Indicators folder with the new version and restart the platform to apply changes.
Frequently Asked Questions
Q: Why is my indicator not showing? A: Verify the file is in the MQL/Indicators folder, or try right-clicking the "Indicators" tree in the Navigator and clicking "Refresh."
Q: Do custom indicators slow down the platform? A: Too many complex indicators can impact performance; remove unused ones via the "Indicator List" (Ctrl+I).
Q: Can I use MT4 indicators on MT5? A: No, MQL4 and MQL5 are distinct languages; ensure the indicator is compiled specifically for your platform version.
What this tool does
Relative Volume (RVOL) Indicator in a SubwindowThe idea behind itRaw volume bars are difficult to interpret.
Typical Use Case
This Indicator excels in automated trading and technical analysis on MetaTrader 5.
Compatible Platform & Setup
This Indicator works on MetaTrader 5. Place the file in the MQL5/Indicators folder and restart the terminal.
Description & Settings
Related: Tick Volume Delta Histogram: Estimating Buy/Sell Pressure - another powerful indicator for MetaTrader 5 traders.
Relative Volume (RVOL) Indicator in a SubwindowAlso recommended: Compression Breakout Channels with Buy and Sell Volume Analysis - similar indicator with strong performance on MetaTrader 5.
The idea behind it
Raw volume bars are difficult to interpret. It is hard to determine if 1,800 ticks is a large or small amount without context. The Relative Volume (RVOL) indicator addresses this by comparing a bar's volume to its historical average for that specific symbol, timeframe, and time of day.
RVOL = volume of the bar / average volume
An RVOL of 1.0 signifies average volume, 2.0 indicates twice the average volume, and 0.5 represents half the average volume. Unusually high RVOL values often signal increased market attention, typically associated with news events, breakouts, stop runs, and the beginning or end of trends. A breakout accompanied by low RVOL is more likely to fail compared to a breakout with high RVOL.
The average volume can be calculated in two ways:
Previous N bars: This method calculates the average volume over the N bars preceding the current one. It is applicable to all timeframes.
Same time of day, previous N days: This method averages the volume of bars that opened at the same time on the previous N trading days. Intraday volume exhibits a distinct daily pattern, with periods of lower activity during Asian trading hours and higher activity during the London and New York opens. This mode neutralizes this daily rhythm, preventing the opening hour from being consistently flagged as having high volume.
The calculation is incremental, meaning that after the initial computation, only the last bar and newly forming bars are recalculated with each incoming tick.
How to interpret it
Histogram: Each candle is represented by a single bar in the histogram, displaying the RVOL for that candle. The scale of the subwindow begins at 0.
Three colors: The histogram bars are displayed in one of three colors. The default color is used for RVOL below a defined high level. A second color is used for RVOL at or above the high level, indicating elevated activity. A third color signifies exceptional activity, used for RVOL at or above an extreme level.
Dotted horizontal levels: These lines represent key thresholds: 1.0 (average volume), the high level, and the extreme level.
Text label: Located in the upper left corner of the subwindow, this label displays the RVOL of the last closed bar along with its status (normal, HIGH, or EXTREME), and the RVOL of the currently forming (live) bar.
The volume of a live bar, which is still forming, is incomplete. Consequently, its RVOL starts near 0 and increases as the bar progresses. It is advisable to evaluate signals based on the closed bar's data. The live RVOL value indicates the development trend of the current bar.
Bars with insufficient historical data to compute the average are left blank. This occurs for the first N bars in the 'Previous N bars' mode. In the 'Same time of day' mode, bars with fewer than 3 days of data (or fewer than N days if N is smaller than 3) are also left blank.
Typical readings suggest that a high RVOL bar with a large price range indicates significant market participation in the move. A high RVOL bar with a small range may suggest volume absorption. A breakout occurring with an RVOL near or below 1.0 is generally considered weak.
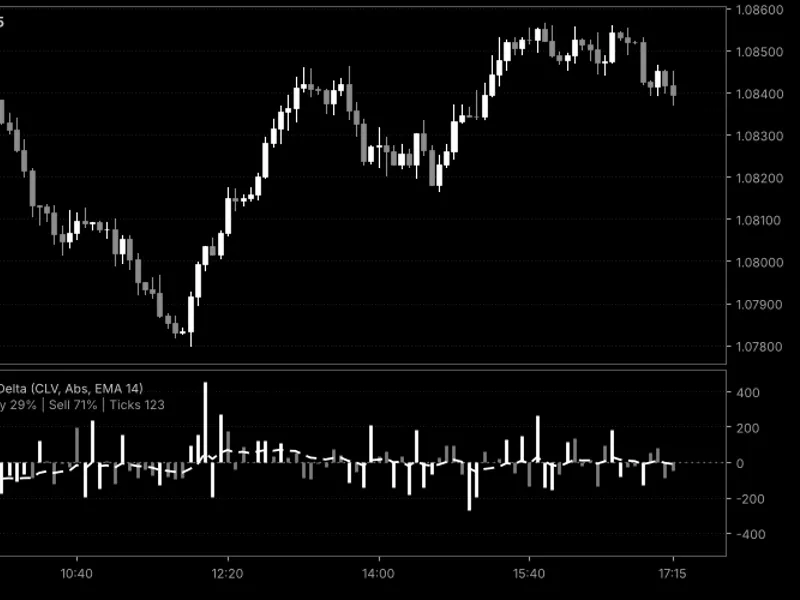
Fig. 1. RVOL(Bars,20) displayed in the subwindow of an EURUSD H1 chart. The histogram includes the 1.0, high, and extreme levels, along with a text label. The image is presented in black and white according to Code Base image guidelines; the three histogram colors are configurable.
External variables (inputs)
Input
Default
Purpose
Baseline
InpMode
RVOL_MODE_BARS
Determines how the average volume is measured. Options include 'previous N bars' (RVOL_MODE_BARS) or 'same time of day on the previous N days' (RVOL_MODE_SAME_TIME). The 'same-time' mode requires an intraday timeframe. For Daily (D1) and higher timeframes, the indicator defaults to using the previous N bars and will display a message in the Experts tab.
InpPeriod
20
N: Specifies the number of bars (in bars mode) or the number of days (in same-time mode) to include in the average calculation. The minimum value is 1.
InpVolumeType
RVOL_VOL_TICK
Defines the volume used in the calculation: tick volume or real volume. If a bar lacks real volume data, tick volume will be used instead.
Levels
InpHighLevel
1.5
Sets the RVOL level at which volume is considered elevated. This triggers the second histogram color and the corresponding dotted level line. This value must be greater than 0.
InpExtremeLevel
3.0
Sets the RVOL level at which volume is considered extreme. This triggers the third histogram color and its associated dotted level line. This value must not be lower than the high level.
Colors and label
InpColorNormal
clrGray
Specifies the histogram color for RVOL values below the high level.
InpColorHigh
clrDodgerBlue
Specifies the histogram color for RVOL values at or above the high level.
InpColorExtreme
clrOrangeRed
Specifies the histogram color for RVOL values at or above the extreme level.
InpShowLabel
true
Enables or disables the display of the text label in the subwindow, which shows the RVOL of the last closed bar and the live bar.
InpLabelColor
clrGray
Sets the color of the text label.
Recommended use
Intraday charts (M1 to H4): It is recommended to use RVOL_MODE_SAME_TIME. This mode compares a bar's volume to the volume of the same hour on previous days, effectively removing the typical daily volume fluctuations from consideration. Bars at the beginning of the historical data or immediately following extended gaps may have fewer comparison days, potentially leading to less reliable or blank readings.
Daily and higher charts: Utilize RVOL_MODE_BARS. A setting of N = 20 corresponds to approximately one trading month on a Daily (D1) chart.
Choosing N: A smaller N value allows for quicker detection of changes in trading activity but can result in a noisier indicator. A larger N value provides a more stable baseline but may react slower to significant shifts in market conditions.
Volume source: For Forex and CFD symbols, the trading terminal typically provides only tick volume, which serves as an indicator of market activity rather than the actual volume of traded lots. This tick volume can vary between brokers. For exchange-traded symbols that offer real volume data, set InpVolumeType to RVOL_VOL_REAL.
Levels: The default levels of 1.5 for the high level and 3.0 for the extreme level are starting points. Analyze the historical data for your specific symbol and adjust these levels so that the 'extreme' color highlights only a small percentage of the bars, typically only the most significant ones.
Multiple instances: The indicator can be attached to the chart multiple times with different settings. Each instance will generate its own unique label, identified by its mode and the value of N.
Chart objects: When enabled (InpShowLabel is true), the indicator creates a single text label on the chart. This label is automatically deleted when the indicator is removed or reloaded.
Account types: This is a visual indicator and does not execute trades. It does not require DLLs and functions identically on both netting and hedging account types.
RVOL serves as a contextual filter and is not a standalone trading signal. It should be used in conjunction with price action analysis, support and resistance levels, or your own predefined entry rules.
You may also like: Simple Anchored VWAP - Institutional Volume Benchmark - excellent alternative for indicator users on MetaTrader 5.
Source Code
#property copyright "RobotFX"
#property link "https://robotfx.org"
#property version   "1.00"
#property description "This code is educational. Feel free to use, modify and upgrade as you wish. Visit ROBOTFX.ORG for professional trading tools"
#property indicator_separate_window
#property indicator_buffers 3
#property indicator_plots   1
#property indicator_minimum 0.0
#property indicator_label1  "RVOL"
#property indicator_type1   DRAW_COLOR_HISTOGRAM
.......
⚠ Limitations & Risk Warning
- This tool is provided for educational and testing purposes only.
- Past performance does not guarantee future results.
- Trading involves substantial risk of loss. Use on a demo account first.
- Results may vary depending on market conditions, broker, and settings.
- We recommend thorough backtesting and forward testing before using with real funds.