Maksi Gen Range Move MT F
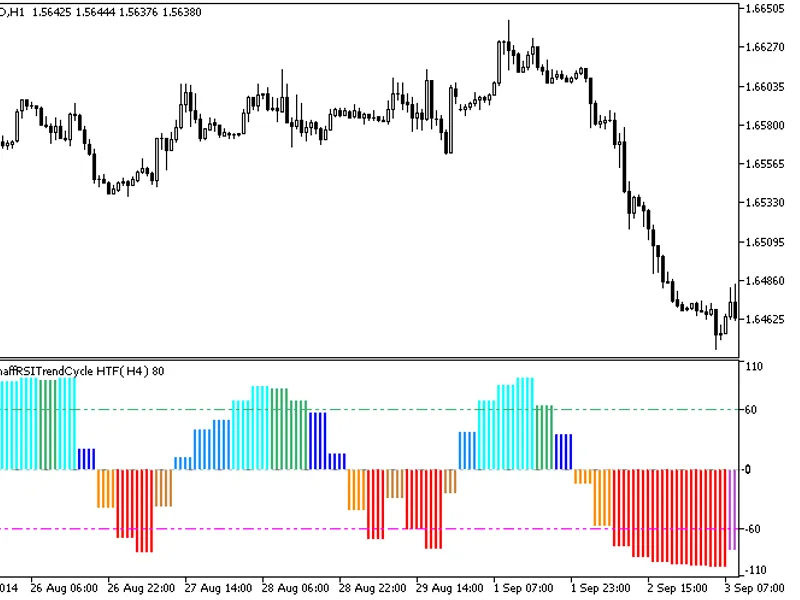
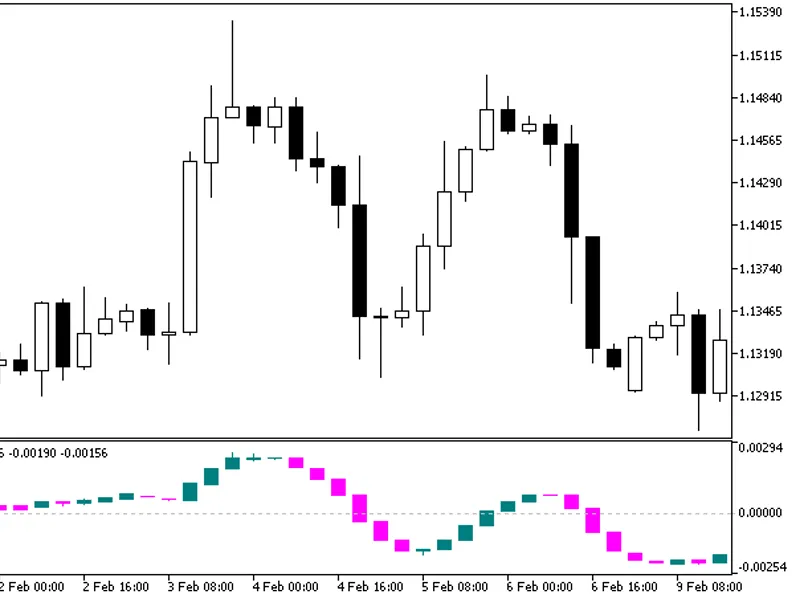
This professional-grade solution for MetaTrader 5 helps traders achieve greater efficiency in their daily workflow. This technical indicator acts as a specialized analysis tool designed to visualize market data. It helps traders identify emerging trends, momentum shifts, and key support or resistance levels by plotting statistical calculations directly onto price charts.
How to Setup and Use Maksi Gen Range Move MT F
1. Installation: Place your file in the MQL/Indicators folder via "Open Data Folder" and restart your terminal.
2. Loading: Find the indicator in the Navigator, drag it onto your chart, and configure the input parameters in the popup window.
3. Customization: Press Ctrl+I to open the indicator list, select your tool, and click "Properties" to change colors, levels, or visual styles.
4. Updating: Replace the old file in the Indicators folder with the new version and restart the platform to apply changes.
Frequently Asked Questions
Q: Why is my indicator not showing? A: Verify the file is in the MQL/Indicators folder, or try right-clicking the "Indicators" tree in the Navigator and clicking "Refresh."
Q: Do custom indicators slow down the platform? A: Too many complex indicators can impact performance; remove unused ones via the "Indicator List" (Ctrl+I).
Q: Can I use MT4 indicators on MT5? A: No, MQL4 and MQL5 are distinct languages; ensure the indicator is compiled specifically for your platform version.
Description & Settings
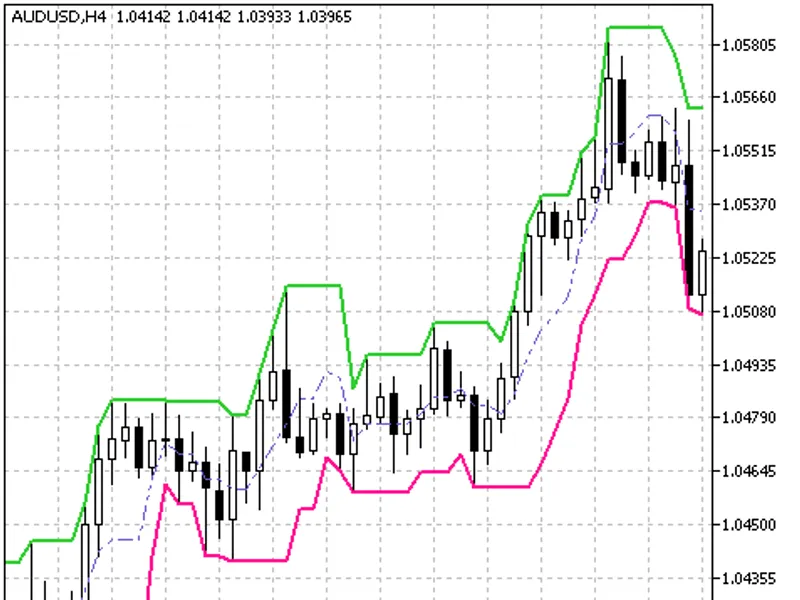
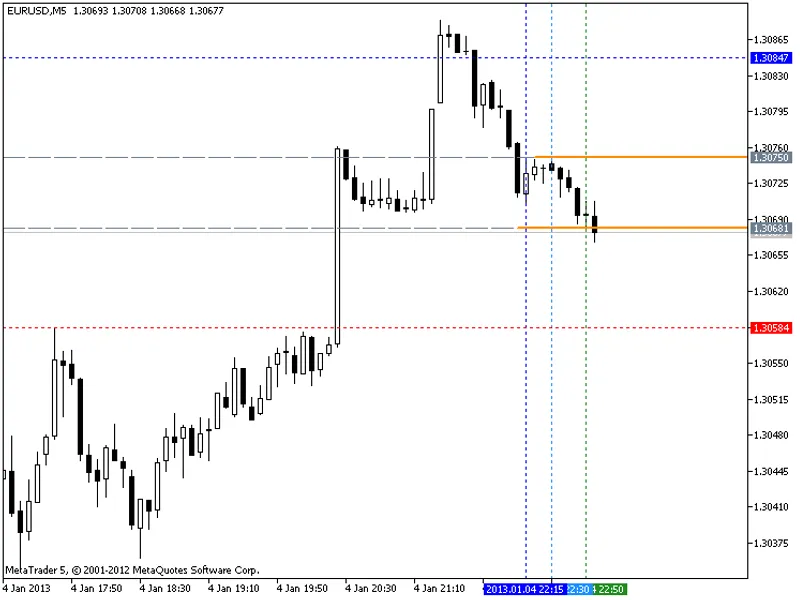
The indicator draws support/resistance lines and the trend lines in the chart.At first it was used as a part of Paramon scalping on М5 and М15 timeframes. Later it was used as an independent indicator to trade on М1 and H4/D1.Support/resistance lines and trend lines are drawn on the number of bars that can be changed in the indicator settings.
Recommendations:
Use the indicator to trade on the lower timeframes, and for the technical analyses on higher timeframes.
The most interesting are support/resistance lines drawn by a dotted red/blue color and that indicates possible buy stop and sell stop pending orders.
The multi-timeframe indicator. Thus to use two or more indicators in one chart use the UniqueID parameter that must be any but unique for each indicator.