Institutional K-Means Machine Learning Liquidity Clusters
This software component for MetaTrader 5 is built to enhance the capabilities of your trading environment. This technical indicator acts as a specialized analysis tool designed to visualize market data. It helps traders identify emerging trends, momentum shifts, and key support or resistance levels by plotting statistical calculations directly onto price charts.
How to Setup and Use Institutional K-Means Machine Learning Liquidity Clusters
1. Installation: Place your file in the MQL/Indicators folder via "Open Data Folder" and restart your terminal.
2. Loading: Find the indicator in the Navigator, drag it onto your chart, and configure the input parameters in the popup window.
3. Customization: Press Ctrl+I to open the indicator list, select your tool, and click "Properties" to change colors, levels, or visual styles.
4. Updating: Replace the old file in the Indicators folder with the new version and restart the platform to apply changes.
Frequently Asked Questions
Q: Why is my indicator not showing? A: Verify the file is in the MQL/Indicators folder, or try right-clicking the "Indicators" tree in the Navigator and clicking "Refresh."
Q: Do custom indicators slow down the platform? A: Too many complex indicators can impact performance; remove unused ones via the "Indicator List" (Ctrl+I).
Q: Can I use MT4 indicators on MT5? A: No, MQL4 and MQL5 are distinct languages; ensure the indicator is compiled specifically for your platform version.
Description & Settings
The Flaw in Retail Support & Resistance
Retail traders manually draw horizontal support and resistance lines based on visual memory and subjective bias, this manual approach is statistically invalid. Institutional algorithms do not care about a line you drew on a chart; they operate on volume density and liquidity clustering.
Unsupervised Machine Learning (K-Means)
To eliminate human bias, quantitative hedge funds use data science. The
Institutional K-Means Liquidity Clusters
indicator brings unsupervised machine learning directly into your MQL5 terminal.
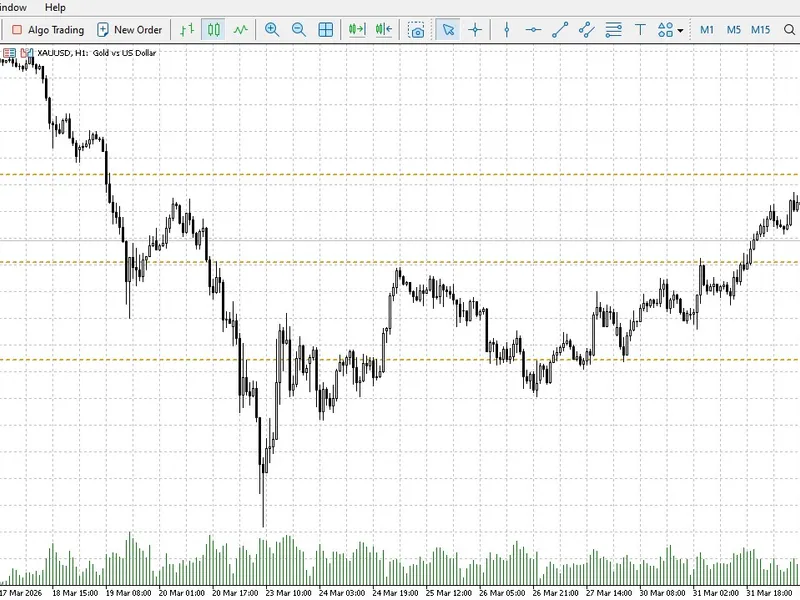
The algorithm processes hundreds of historical price points and mathematically groups them into distinct clusters of high density, the center of these clusters (the "Centroids") represents the exact price levels where liquidity is mathematically concentrated.
Core Quantitative Architecture
Mathematical Objectivity:
Automatically finds the exact mean of execution clusters, plotting dynamic support and resistance levels that adapt to the shifting market regime.
Zero External Dependencies:
The classic K-Means algorithm was written natively in C++ (MQL5), meaning it executes complex machine learning arrays in microseconds without requiring slow Python bridges or external DLLs.
Dynamic Re-clustering:
The engine recalculates the centroids at the close of specific algorithmic intervals to ensure your liquidity map is always aligned with the most recent institutional order flow.
Execution Protocol
Attach the Engine:
Deploy the indicator on structural timeframes (H1, H4, or D1) to map the macro liquidity clusters.
Combine with Flow:
Use this macro-map in conjunction with order flow indicators (like CVD or Z-Score) to snipe entries when the price hits a K-Means centroid.