Institutional Anchored VW A P (Smart Money Benchmark)
This software component for MetaTrader 4 is built to enhance the capabilities of your trading environment. This technical indicator acts as a specialized analysis tool designed to visualize market data. It helps traders identify emerging trends, momentum shifts, and key support or resistance levels by plotting statistical calculations directly onto price charts.
How to Setup and Use Institutional Anchored VW A P (Smart Money Benchmark)
1. Installation: Place your file in the MQL/Indicators folder via "Open Data Folder" and restart your terminal.
2. Loading: Find the indicator in the Navigator, drag it onto your chart, and configure the input parameters in the popup window.
3. Customization: Press Ctrl+I to open the indicator list, select your tool, and click "Properties" to change colors, levels, or visual styles.
4. Updating: Replace the old file in the Indicators folder with the new version and restart the platform to apply changes.
Frequently Asked Questions
Q: Why is my indicator not showing? A: Verify the file is in the MQL/Indicators folder, or try right-clicking the "Indicators" tree in the Navigator and clicking "Refresh."
Q: Do custom indicators slow down the platform? A: Too many complex indicators can impact performance; remove unused ones via the "Indicator List" (Ctrl+I).
Q: Can I use MT4 indicators on MT5? A: No, MQL4 and MQL5 are distinct languages; ensure the indicator is compiled specifically for your platform version.
Description & Settings
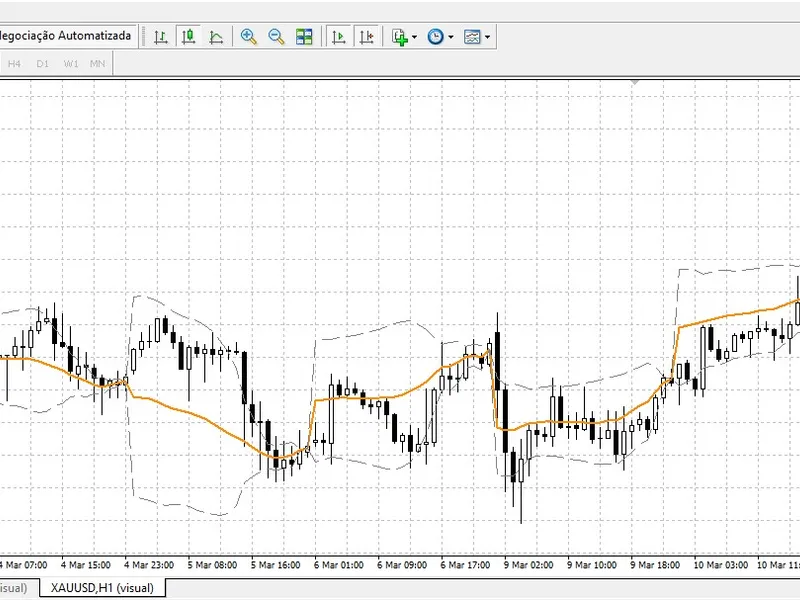
Retail traders use Moving Averages; Institutional algorithms use the VWAP. When a hedge fund or liquidity provider executes massive block orders, their execution algorithms are benchmarked against the Volume Weighted Average Price. They accumulate positions when the price is below the VWAP (Discount) and distribute when it is above (Premium).
MetaTrader 4 lacks a native, institutional-grade Anchored VWAP. This indicator bridges that gap by calculating the true volume-weighted price from the exact start of your chosen session (Daily, Weekly, or Monthly) and projecting standard deviation bands to identify extreme algorithmic over-extension.
Core Features
True Mathematical VWAP:
Calculates the cumulative Typical Price (H+L+C)/3 multiplied by tick volume, providing the actual "fair value" line of the day.
Dynamic Anchoring:
Automatically resets the calculation at the start of a new Day, Week, or Month without any repainting.
Zero Lag & CPU Optimized:
Modern MQL4 OnCalculate structure ensures the indicator runs instantly even on a 10-year historical chart without freezing the terminal.
Input Parameters
AnchorPeriod:
Choose between PERIOD_D1, PERIOD_W1, or PERIOD_MN1.
DeviationMultiplier:
The standard deviation multiplier for the outer bands (Default is 2.0).
Line Styles:
Fully customizable colors and weights for the VWAP and Bands.