Institutional Market Reversal - The SM C way
This professional-grade solution for MetaTrader 5 helps traders achieve greater efficiency in their daily workflow. This technical indicator acts as a specialized analysis tool designed to visualize market data. It helps traders identify emerging trends, momentum shifts, and key support or resistance levels by plotting statistical calculations directly onto price charts.
How to Setup and Use Institutional Market Reversal - The SM C way
1. Installation: Place your file in the MQL/Indicators folder via "Open Data Folder" and restart your terminal.
2. Loading: Find the indicator in the Navigator, drag it onto your chart, and configure the input parameters in the popup window.
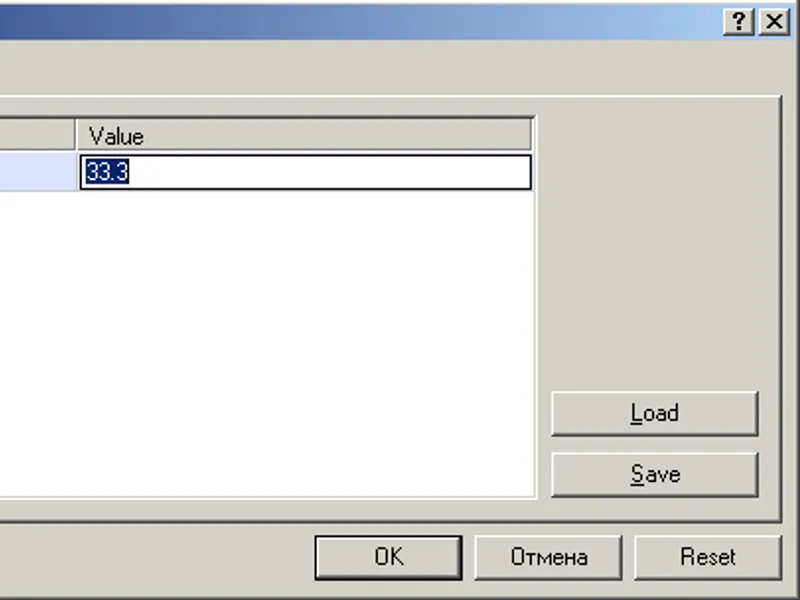
3. Customization: Press Ctrl+I to open the indicator list, select your tool, and click "Properties" to change colors, levels, or visual styles.
4. Updating: Replace the old file in the Indicators folder with the new version and restart the platform to apply changes.
Frequently Asked Questions
Q: Why is my indicator not showing? A: Verify the file is in the MQL/Indicators folder, or try right-clicking the "Indicators" tree in the Navigator and clicking "Refresh."
Q: Do custom indicators slow down the platform? A: Too many complex indicators can impact performance; remove unused ones via the "Indicator List" (Ctrl+I).
Q: Can I use MT4 indicators on MT5? A: No, MQL4 and MQL5 are distinct languages; ensure the indicator is compiled specifically for your platform version.
Description & Settings
Think of IMR as the
diagnostic dashboard behind your price-action strategy
. It gives you confidence for your you ICT/SMC trading approach.
Why This Matters
Most retail traders fail not because their strategy is wrong, but because they apply the right strategy to the
market phase (accumulation, distribution or continuation)
For SMC / ICT Traders: Reading Accumulation & Distribution
Smart Money Concepts and ICT methodologies revolve around the idea that institutional order flow leaves footprints: order blocks, fair value gaps, breaker blocks, and liquidity sweeps. But the missing piece in most SMC/ICT education is
timing
— knowing when those footprints are likely to resolve.
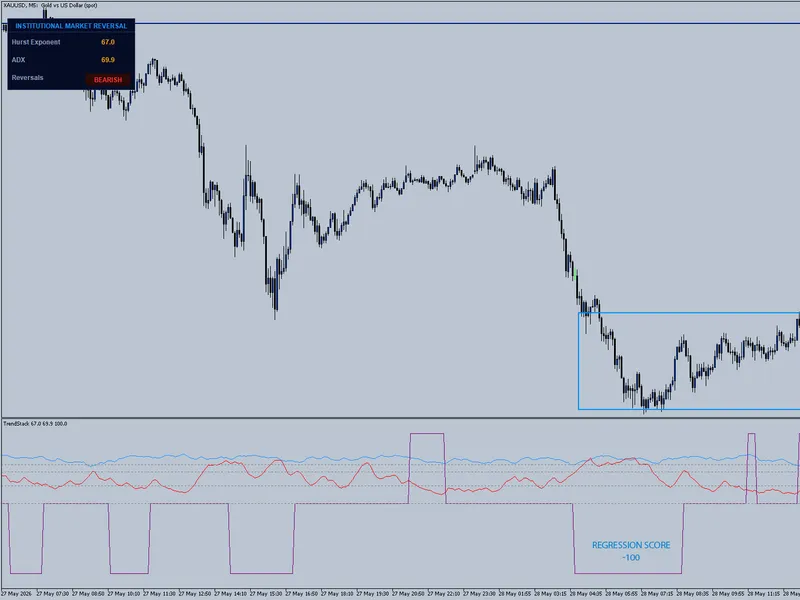
The Regression Score (RegScore) is that missing piece.
When RegScore hits
+100
, it means price has moved upward in a
statistically perfect straight line
over the lookback period. The regression fit is confident (R² ≥ 0.60). In SMC terms, this is often the tail end of an
accumulation phase
or a liquidity-engineered rally. The move is "too clean." When a move is too clean on a certain timeframe, it is often the final thrust before a reversal or retracement to a higher-timeframe order block.
When RegScore hits
–100
, the same logic applies to the downside. Price has sold off in a disciplined, linear fashion. This is often
distribution
completing its cycle or
accumulation
kicking in. start looking for ChoCh or
How to use it with your price-action toolkit:
Do
not
take the +100 or –100 as an entry signal. Take it as a
heads-up
.
When RegScore hits +100 while Hurst is below 0.45 (mean-reverting regime), you have a statistical warning that the premium array is overextended. Now you look left for a
bearish order block
or
breaker
to frame your short.
When RegScore hits –100 with Hurst below 0.45, you hunt for a
bullish order block
in the discount array.
When Hurst is above 0.55 (trending regime), a +100 RegScore tells you the trend has
conviction
. Do not fade it. Wait for a pullback to a
bullish order block
in the premium array to join the move, not fight it.
Component 1: Hurst Exponent
How it works:
Calculated via the
Rescaled Range (R/S)
method on log returns (not raw prices), the Hurst Exponent produces a value between 0 and 1.
H > 0.55:
The market has
positive memory
. If price moved up, it is likely to keep moving up. Breakout strategies, order-block continuation trades, and trend-following fair-value-gap entries work here.
H ≈ 0.50:
Random walk. No statistical edge. The market is efficient. Your order block might look perfect, but the math says there is no directional bias.
Stay flat.
Note that on the panel and on the indicator window these values are as 55, 45 and 50 (Multiplied by 100)
Component 2: ADX
The Average Directional Index (ADX) measures the
strength
of a trend, not its direction. It is derived from the smoothed expansion of the +DI and –DI lines.
How to read it:
ADX < 20–25:
The market is sleeping. There is no trend strength. Even if you see a clean order block, the underlying energy is not there. Avoid entries.
ADX 25–50:
Trend strength is building. This is the sweet spot for most price-action setups. Your order blocks and fair value gaps are more likely to resolve because institutional flow is directional.
ADX > 50:
The move is climactic. In SMC/ICT terms, this is often the
manipulation phase
— the final aggressive push to take liquidity before a reversal. When ADX is extreme and RegScore is maxed out, Smart Money is likely transitioning from accumulation/distribution into the next phase.
ADX does not tell you direction.
It tells you
commitment
. Use it to confirm that the order block you are watching is backed by real volume and intent, not just random retail noise.
Component 3: Linear Regression with R²
The regression component fits a straight line to the recent closing prices and returns two things:
Slope:
Which way is the line pointing?
R² (Coefficient of Determination):
How well do the actual prices hug that line?
RegScore translates this into a directional confidence score:
+100:
Strong positive slope with a high-confidence fit (R² ≥ 0.60). Price is moving up in a disciplined, non-choppy manner. A bearish reversal is about to happen
–100:
Strong negative slope with a high-confidence fit. Price is moving down in a disciplined manner. A bullish reversal is about to happen
0:
No confidence. The price action is too choppy to fit a clean line. The regression is unreliable.
For SMC/ICT traders, this is critical:
A +100 RegScore on a lower timeframe, when mapped against a higher-timeframe premium array, suggests the
engineered move is complete
. The algorithmic/institutional buying that created the accumulation has reached statistical saturation. Time to look for distribution footprints.
A –100 RegScore in a discount array suggests the sell-off has reached statistical exhaustion. Time to look for accumulation footprints — a bullish order block or a sweep of a key low