Market Flow Analysis Method (MF A M) Indicator for Price Action
This professional-grade solution for MetaTrader 4 helps traders achieve greater efficiency in their daily workflow. This technical indicator acts as a specialized analysis tool designed to visualize market data. It helps traders identify emerging trends, momentum shifts, and key support or resistance levels by plotting statistical calculations directly onto price charts.
How to Setup and Use Market Flow Analysis Method (MF A M) Indicator for Price Action
1. Installation: Place your file in the MQL/Indicators folder via "Open Data Folder" and restart your terminal.
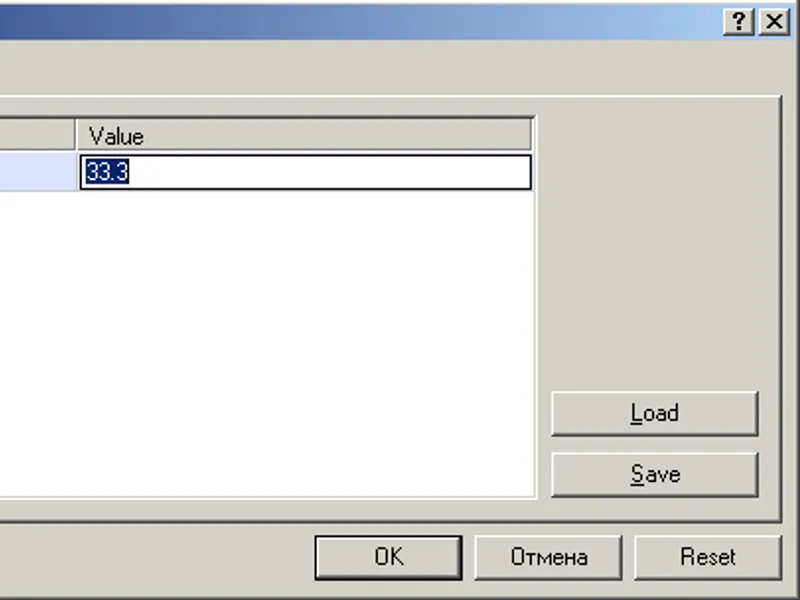
2. Loading: Find the indicator in the Navigator, drag it onto your chart, and configure the input parameters in the popup window.
3. Customization: Press Ctrl+I to open the indicator list, select your tool, and click "Properties" to change colors, levels, or visual styles.
4. Updating: Replace the old file in the Indicators folder with the new version and restart the platform to apply changes.
Frequently Asked Questions
Q: Why is my indicator not showing? A: Verify the file is in the MQL/Indicators folder, or try right-clicking the "Indicators" tree in the Navigator and clicking "Refresh."
Q: Do custom indicators slow down the platform? A: Too many complex indicators can impact performance; remove unused ones via the "Indicator List" (Ctrl+I).
Q: Can I use MT4 indicators on MT5? A: No, MQL4 and MQL5 are distinct languages; ensure the indicator is compiled specifically for your platform version.
Description & Settings
The concept comes from Market Flow Analysis Method (MFAM) mentioned on by Todd Mitchell (I have no relationship with this website nor Todd Mitchell)
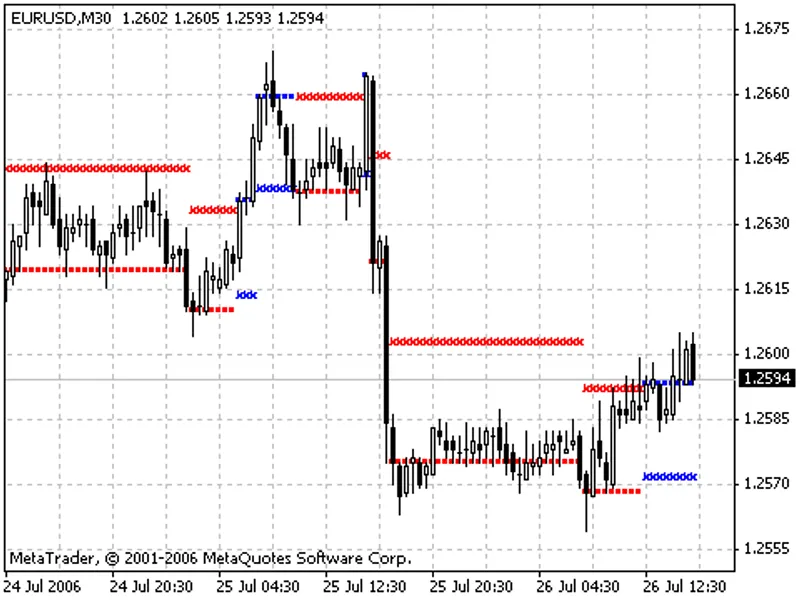
The program keeps track of Highest Highs (& Lowest Lows) and also whether there a trend change seems to be taking place.
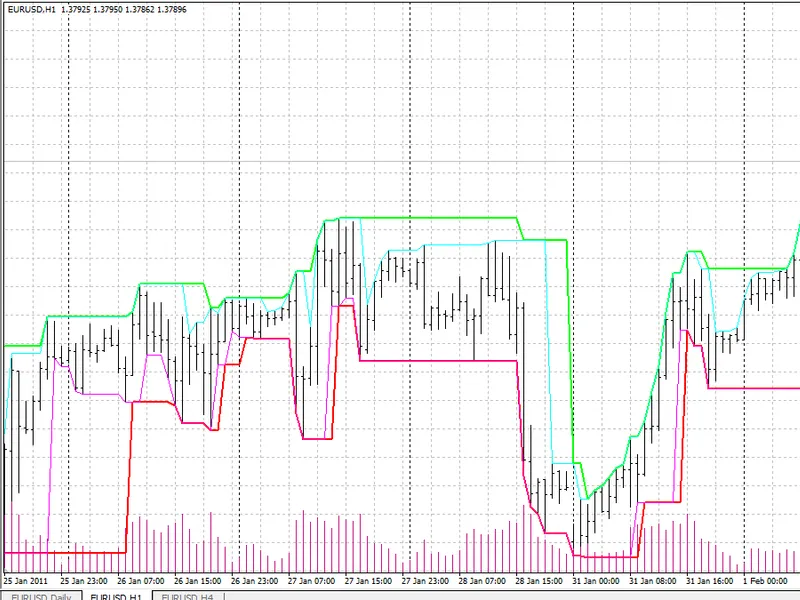
The bold Red & Green indicate the Highest High & Lowest Low. The fainter cyan & magenta lines track Active High & Low, which may become Highest/Lowest if a Price Break occurs.
The theory is that you go long when price breaks through the Highest High, or short when it breaks drops below Lowest Low. This is signaled when the green line jumps up, or the red line down.
A PDF explaining this is concept also available at
Whilst developing it, I initially just tracked 'periods since Highest High' etc into a separate chart. With a one-line source change (indicator chart) & one parameter, this can be recreated.
There is also another parameter to limit how long a Highest High etc can be active for (This was added with the intention of removing the usage of 4 buffers, but has not been done).
Image: