Cluster Box Histogramm - horizontal cross-section of the market
This is a powerful addition to your MetaTrader 4 toolkit designed to optimize market analysis and performance. This technical indicator acts as a specialized analysis tool designed to visualize market data. It helps traders identify emerging trends, momentum shifts, and key support or resistance levels by plotting statistical calculations directly onto price charts.
How to Setup and Use Cluster Box Histogramm - horizontal cross-section of the market
1. Installation: Place your file in the MQL/Indicators folder via "Open Data Folder" and restart your terminal.
2. Loading: Find the indicator in the Navigator, drag it onto your chart, and configure the input parameters in the popup window.
3. Customization: Press Ctrl+I to open the indicator list, select your tool, and click "Properties" to change colors, levels, or visual styles.
4. Updating: Replace the old file in the Indicators folder with the new version and restart the platform to apply changes.
Frequently Asked Questions
Q: Why is my indicator not showing? A: Verify the file is in the MQL/Indicators folder, or try right-clicking the "Indicators" tree in the Navigator and clicking "Refresh."
Q: Do custom indicators slow down the platform? A: Too many complex indicators can impact performance; remove unused ones via the "Indicator List" (Ctrl+I).
Q: Can I use MT4 indicators on MT5? A: No, MQL4 and MQL5 are distinct languages; ensure the indicator is compiled specifically for your platform version.
Description & Settings
General Information
For each candlestick of any timeframe there is a corresponding amount of ticks that formed it. On Forex charts this trait is displayed as Volume, although it has no direct relation to the real trade volumes. However, the tick volume data can be in the same way as the real volume data.
The information about the ticks that came before the indicator was attached are taken from the special tick file, which is formed with the help of the . A ready-made tick file can also be taken from the . If the history rendering is not required, then the indicator values will appear in real-time, provided the new ticks arrive.
About the ClusterBox_Histogramm indicator
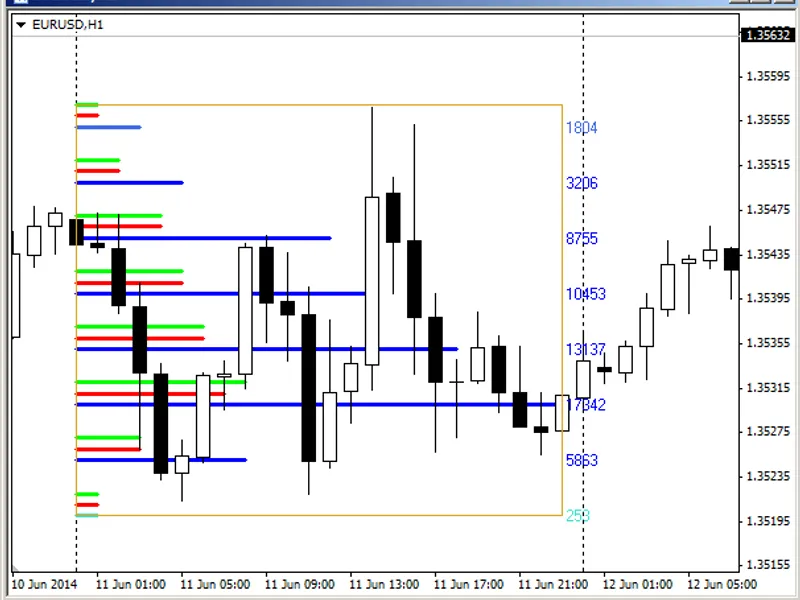
Unlike the indicator, that displays the amount of ticks per one cluster within a single candlestick, the ClusterBox_Histogramm indicator calculates the amount of ticks of one cluster, which combines several candlesticks. That is the specified interval of the candlesticks is considered as a single candlestick split into clusters. For each such cluster, the amount of ticks within it is calculated.
The blue and light blue lines on the chart — total amount of ticks per one cluster. The precise value of this number is displayed to the right of the rectangle, that bounds the data collection interval. The colors of these lines depends on the amount of ticks and values of the setting parameters of the "Min. volumes and colors" block.
Red and green lines — the amount of ticks per fall and growth prices respectively. Set in the "Delta of volumes" parameters block.
The data collection interval is set by moving and/or dragging the rectangle.
More detailed information can be found in the article .