GA R C H Indicator - Industrial Level Volatility Estimator
This professional-grade solution for MetaTrader 5 helps traders achieve greater efficiency in their daily workflow. This technical indicator acts as a specialized analysis tool designed to visualize market data. It helps traders identify emerging trends, momentum shifts, and key support or resistance levels by plotting statistical calculations directly onto price charts.
How to Setup and Use GA R C H Indicator - Industrial Level Volatility Estimator
1. Installation: Place your file in the MQL/Indicators folder via "Open Data Folder" and restart your terminal.
2. Loading: Find the indicator in the Navigator, drag it onto your chart, and configure the input parameters in the popup window.
3. Customization: Press Ctrl+I to open the indicator list, select your tool, and click "Properties" to change colors, levels, or visual styles.
4. Updating: Replace the old file in the Indicators folder with the new version and restart the platform to apply changes.
Frequently Asked Questions
Q: Why is my indicator not showing? A: Verify the file is in the MQL/Indicators folder, or try right-clicking the "Indicators" tree in the Navigator and clicking "Refresh."
Q: Do custom indicators slow down the platform? A: Too many complex indicators can impact performance; remove unused ones via the "Indicator List" (Ctrl+I).
Q: Can I use MT4 indicators on MT5? A: No, MQL4 and MQL5 are distinct languages; ensure the indicator is compiled specifically for your platform version.
Description & Settings
The
Generalized AutoRegressive Conditional Heteroskedasticity (GARCH)
volatility/volume indicator is based on the GARCH(1,1) recursion model, which is used in financial markets to forecast the volatility of the price action of financial assets. This statistical model is used in financial time series analysis where the variance of a time series is assumed to be autocorrelated and that the error term (difference between model prediction and what actually happens) has an autoregressive moving average process which can be modeled. The error term variation of financial markets is always irregular, hence the name heteroskedacticity.
Financial institutions use the GARCH model as an estimator for the volatility of stocks, bonds and market indices. This indicator has been tested with Forex, commodities (XAUUSD) and crypto (BTCUSD).
Input space:
Gamma variable
- constant term (unconditional variance)
Alpha variable
- ARCH coefficient (reaction to last shock)
Beta variable
- Generalized ARCH coefficient (persistence of past variance)
Bar window
- Amount of bars to include in rolling mean/std.
Threshold scale
- Default is 1. Lines:
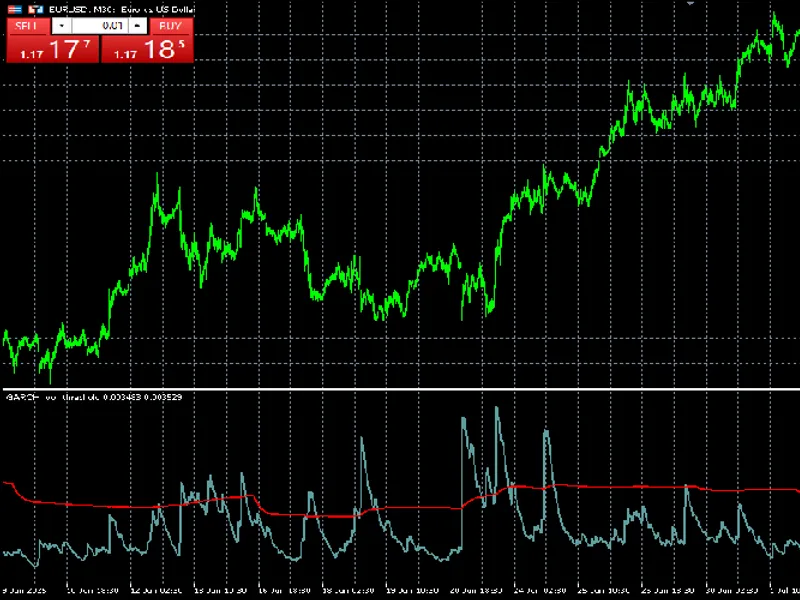
The cadet-blue line represent the GARCH one-step forecast values of the volatility (variance) for the next candle. This line is calculated using the GARCH(1,1) formula for volatility. During drastic return changes, the line spikes up and slowly decays back to its baseline, indicating a high volatile period.
The red line represents the threshold for identifying high/low volatile periods. This allows for a two-line-cross signal identification for the trader, whilst also allowing expert advisors to easily identify highly volatile areas. The threshold scale can also be amplified.
This indicator might not work as intended with M1, M5 timeframes.