








Value Area Levels Indicator
Info
The Value Area Levels Indicator is a Indicator for MetaTrader 5 that value area levels calculates a price-volume distribution from lower-timeframe candle data and displays the following important market profile levels:vah — value area highpoc — point of controlval — value area lowdvah, dpoc and dval — developing profile levelspdvah, pdpoc and pdval — previous completed profile levelsthe indicator can calculate daily, weekly, monthly, or other timeframe-based profiles while using a separate source timeframe for profile construction. For example, the indicator can calculate daily Value Area levels using M15 candle data.
Usage
This tool is typically used for enhancing chart analysis and decision making.
Platform
This Indicator works exclusively on MetaTrader 5 (both build 600+ and newer versions).
Setup
Place the downloaded file in MQL5/Indicators folder via File ? Open Data Folder in MetaTrader 5.
How to Install and Use Value Area Levels Indicator
1. Installation: Place your file in the MQL/Indicators folder via "Open Data Folder" and restart your terminal.
2. Loading: Find the indicator in the Navigator, drag it onto your chart, and configure the input parameters in the popup window.
3. Customization: Press Ctrl+I to open the indicator list, select your tool, and click "Properties" to change colors, levels, or visual styles.
4. Updating: Replace the old file in the Indicators folder with the new version and restart the platform to apply changes.
Frequently Asked Questions
Q: Why is my indicator not showing? A: Verify the file is in the MQL/Indicators folder, or try right-clicking the "Indicators" tree in the Navigator and clicking "Refresh."
Q: Do custom indicators slow down the platform? A: Too many complex indicators can impact performance; remove unused ones via the "Indicator List" (Ctrl+I).
Q: Can I use MT4 indicators on MT5? A: No, MQL4 and MQL5 are distinct languages; ensure the indicator is compiled specifically for your platform version.
What this tool does
Value Area Levels calculates a price-volume distribution from lower-timeframe candle data and displays the following important market profile levels:VAH — Value Area HighPOC — Point of ControlVAL — Value Area LowDVAH, DPOC and DVAL — Developing profile levelsPDVAH, PDPOC and PDVAL — Previous completed profile levelsThe indicator can calculate daily, weekly, monthly, or other timeframe-based profiles while using a separate source timeframe for profile construction.
Typical Use Case
This Indicator excels in automated trading and technical analysis on MetaTrader 5.
Compatible Platform & Setup
This Indicator works on MetaTrader 5. Place the file in the MQL5/Indicators folder and restart the terminal.
Description & Settings
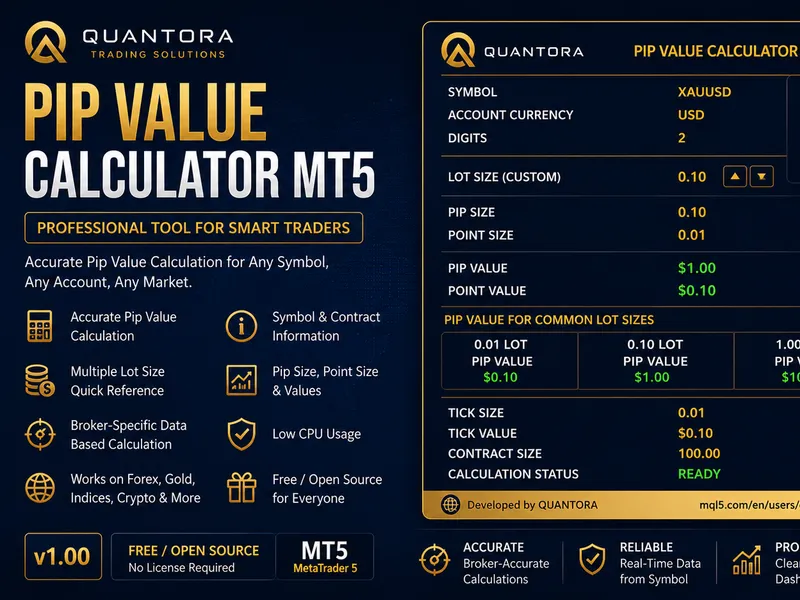
Related: Quantora Pip Value Calculator MT5: Professional Pip and Point Value Calculator for MetaTrader 5 - another powerful indicator for MetaTrader 5 traders.
Value Area Levels calculates a price-volume distribution from lower-timeframe candle data and displays the following important market profile levels:Also recommended: Pip Value Calculator - similar indicator with strong performance on MetaTrader 5.
VAH — Value Area High
POC — Point of Control
VAL — Value Area Low
DVAH, DPOC and DVAL — Developing profile levels
PDVAH, PDPOC and PDVAL — Previous completed profile levels
The indicator can calculate daily, weekly, monthly, or other timeframe-based profiles while using a separate source timeframe for profile construction.
For example, the indicator can calculate daily Value Area levels using M15 candle data.
The current profile is updated periodically, while completed historical profiles remain fixed until a full chart refresh or the beginning of a new profile period.
Main Features
Developing Value Area
Displays the Value Area High, Point of Control, and Value Area Low of the currently active profile.
The developing levels are identified as:
DVAH
DPOC
DVAL
These levels update as new market data becomes available.
Previous Profile Levels
Displays the completed Value Area levels of the previous session across the current session.
The previous profile levels are identified as:
PDVAH
PDPOC
PDVAL
These levels may be useful as potential support, resistance, acceptance, rejection, or breakout reference areas.
Historical Value Areas
The indicator can display the completed VAH, POC, and VAL levels for multiple historical sessions.
It can also project each previous session’s Value Area levels into the following historical session.
For example, Monday’s completed Value Area levels can be displayed as previous-day levels across Tuesday’s chart area.
Configurable Profile Timeframe
The profile calculation period can be selected independently from the chart timeframe.
Supported examples include:
- Daily profiles
- Weekly profiles
- Monthly profiles
- H4 profiles
- H1 profiles
Configurable Source Timeframe
A separate lower timeframe can be selected as the data source for profile construction.
For example:
Profile timeframe: D1
Source timeframe: M15
Using a lower source timeframe generally creates a more detailed profile but requires more processing.
Tick or Real Volume
The indicator supports:
- Tick volume
- Real volume
When real volume is selected but unavailable or equal to zero, the indicator automatically falls back to tick volume.
Custom Value Area Percentage
The Value Area percentage is configurable.
The default value is 70%, which is commonly used in market profile and volume profile analysis.
Session Separation
Optional vertical lines can be displayed at the beginning of each profile period to visually separate sessions.
The vertical line color, width, and style can be customized.
You may also like: fair value gap fv g mt5 indicator - excellent alternative for indicator users on MetaTrader 5.
Source Code
#property copyright "RobotFX"
#property version   "1.0"
#property description "This code is educational. Feel free to use, modify and upgrade as you wish. Visit ROBOTFX.ORG for professional trading tools"
#property strict
#property indicator_chart_window
#property indicator_buffers 3
#property indicator_plots   3
#property indicator_label1  "VAH"
#property indicator_type1   DRAW_NONE
#property indicator_label2  "POC"
.......
⚠ Limitations & Risk Warning
- This tool is provided for educational and testing purposes only.
- Past performance does not guarantee future results.
- Trading involves substantial risk of loss. Use on a demo account first.
- Results may vary depending on market conditions, broker, and settings.
- We recommend thorough backtesting and forward testing before using with real funds.