



Extrapolator: Advanced Time Series Price Forecasting Indicator
Info
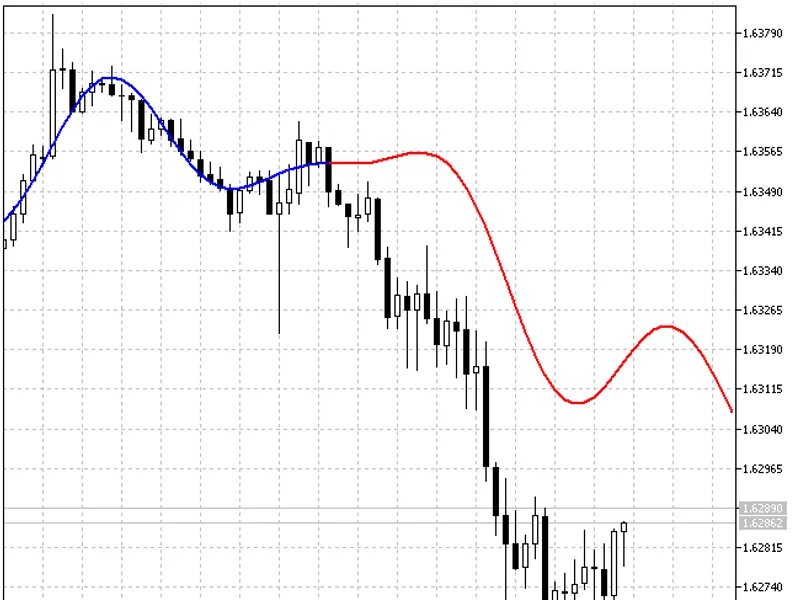
The Extrapolator: Advanced Time Series Price Forecasting Indicator is a Indicator for MetaTrader 5 that extrapolator is the result of extensive research in time series forecasting, designed to predict future price movements. This indicator visually represents forecasted prices with two distinct lines: a blue line indicating historical model prices on training bars, and a red line showing the predicted future prices.
Usage
This tool is typically used for enhancing chart analysis and decision making.
Platform
This Indicator works exclusively on MetaTrader 5 (both build 600+ and newer versions).
Setup
Place the downloaded file in MQL5/Indicators folder via File ? Open Data Folder in MetaTrader 5.
How to Install and Use Extrapolator: Advanced Time Series Price Forecasting Indicator
1. Installation: Place your file in the MQL/Indicators folder via "Open Data Folder" and restart your terminal.
2. Loading: Find the indicator in the Navigator, drag it onto your chart, and configure the input parameters in the popup window.
3. Customization: Press Ctrl+I to open the indicator list, select your tool, and click "Properties" to change colors, levels, or visual styles.
4. Updating: Replace the old file in the Indicators folder with the new version and restart the platform to apply changes.
Frequently Asked Questions
Q: Why is my indicator not showing? A: Verify the file is in the MQL/Indicators folder, or try right-clicking the "Indicators" tree in the Navigator and clicking "Refresh."
Q: Do custom indicators slow down the platform? A: Too many complex indicators can impact performance; remove unused ones via the "Indicator List" (Ctrl+I).
Q: Can I use MT4 indicators on MT5? A: No, MQL4 and MQL5 are distinct languages; ensure the indicator is compiled specifically for your platform version.
What this tool does
Extrapolator is the result of extensive research in time series forecasting, designed to predict future price movements.
Typical Use Case
This Indicator excels in automated trading and technical analysis on MetaTrader 5.
Compatible Platform & Setup
This Indicator works on MetaTrader 5. Place the file in the MQL5/Indicators folder and restart the terminal.
Description & Settings
Related: EVT Crash Gauge: Advanced Tail-Risk Measurement - another powerful indicator for MetaTrader 5 traders.
Extrapolator is the result of extensive research in time series forecasting, designed to predict future price movements.Also recommended: Footprint X Ray: Advanced Order Flow and Volume Delta Analysis - similar indicator with strong performance on MetaTrader 5.
This indicator visually represents forecasted prices with two distinct lines: a blue line indicating historical model prices on training bars, and a red line showing the predicted future prices.The indicator offers a selection of forecasting methods via the 'method' input variable:
- Fourier series extrapolation, with frequencies calculated using the Quinn-Fernandes algorithm.
- Autocorrelation method.
- Weighted Burg method.
- Burg method with Helme-Nikias weighting function.
- Itakura-Saito (geometric) method.
- Modified covariance method.
Methods 2 through 6 employ linear prediction. Linear prediction involves calculating future values as a linear combination of past values. Assuming a price range X[0]..X[n-1] where the lowest index represents the most recent prices, the forecasting of the future price X[n] is calculated as:
X[n] = a[1]*X[n-1] + ... + a[p]*X[n-p]
Where:
- a[i=1..p] are the model coefficients.
- p is the model order.
Methods 2 through 6 determine the 'a[]' coefficients by minimizing the mean-root-square error over the last n-p training bars.
A zero-error forecast on training bars can be achieved by directly solving the aforementioned linear equation system where n=2*p, using the Levinson-Durbin algorithm. This approach is known as the Prony method, but it suffers from unstable future value forecasts and is therefore not included.
Additional input parameters include:
- lastbar: The index of the last bar in the previous data set.
- pastbars: The number of preceding bars used for future value prediction.
- lporder: The order of the linear prediction model, expressed as a fraction of the number of previous bars (0 to 1).
- futbars: The number of future bars to be forecasted.
- harmno: The maximum number of frequencies to consider for method 1 (a value of 0 selects all frequencies).
- freqtol: A measure of inaccuracy in frequency calculation for method 1 (values greater than 0.001 may lead to convergence issues).
- burgwin: The weighting function index for method 2 (0 for rectangular, 1 for Hamming, 2 for parabolic).
This indicator was initially developed in MQL4 and first published in December 2026.
You may also like: super trend quant pro elite: advanced adaptive trend analysis - excellent alternative for indicator users on MetaTrader 5.
Source Code
#property copyright "robotfx"
#property link "https://robotfx.org"
#property version   "1.00"
#property indicator_chart_window
#property indicator_buffers 2
#property indicator_plots   2
#property indicator_type1   draw_line
#property indicator_color1  red
#property indicator_style1  style_solid
#property indicator_width1  1
.......
⚠ Limitations & Risk Warning
- This tool is provided for educational and testing purposes only.
- Past performance does not guarantee future results.
- Trading involves substantial risk of loss. Use on a demo account first.
- Results may vary depending on market conditions, broker, and settings.
- We recommend thorough backtesting and forward testing before using with real funds.