











confluence detector
Info
The confluence detector is a Indicator for MetaTrader 5 that the indicator draws three line plots on the chart. it detects the current period, and you assign two other periods in the input which should compare to the current period.
Usage
This tool is typically used for enhancing chart analysis and decision making.
Platform
This Indicator works exclusively on MetaTrader 5 (both build 600+ and newer versions).
Setup
Place the downloaded file in MQL5/Indicators folder via File ? Open Data Folder in MetaTrader 5.
How to Install and Use confluence detector
1. Installation: Place your file in the MQL/Indicators folder via "Open Data Folder" and restart your terminal.
2. Loading: Find the indicator in the Navigator, drag it onto your chart, and configure the input parameters in the popup window.
3. Customization: Press Ctrl+I to open the indicator list, select your tool, and click "Properties" to change colors, levels, or visual styles.
4. Updating: Replace the old file in the Indicators folder with the new version and restart the platform to apply changes.
Frequently Asked Questions
Q: Why is my indicator not showing? A: Verify the file is in the MQL/Indicators folder, or try right-clicking the "Indicators" tree in the Navigator and clicking "Refresh."
Q: Do custom indicators slow down the platform? A: Too many complex indicators can impact performance; remove unused ones via the "Indicator List" (Ctrl+I).
Q: Can I use MT4 indicators on MT5? A: No, MQL4 and MQL5 are distinct languages; ensure the indicator is compiled specifically for your platform version.
What this tool does
the indicator draws three line plots on the chart.
Typical Use Case
This Indicator excels in automated trading and technical analysis on MetaTrader 5.
Compatible Platform & Setup
This Indicator works on MetaTrader 5. Place the file in the MQL5/Indicators folder and restart the terminal.
Description & Settings
Related: SMC Order Block Detector with Alert for MT5 - another powerful indicator for MetaTrader 5 traders.
the indicator draws three line plots on the chart. it detects the current period, and you assign two other periods in the input which should compare to the current period.
Also recommended: institutional fractal dimension index (regime detector) - similar indicator with strong performance on MetaTrader 5.
if the price is not moving in the same direction on the other timeframes you selected, the lines will deviate from each other and this shows that there is a lack of confluence between those timeframes.when the lines move apart, it can be a signal to avoid trading during that time. it is safer to trade when there is confluence between multiple timeframes.
it is an experimental indicator. a simple minimal science experiment.
first plot is a line chart on the closing prices of the current period.
second plot is the deviation of 1st input timeframe to current period.
third plot is the deviation of 2nd input timeframe to current period.
you can often see a much different chart when you switch from one timeframe to another. this proves that m1 price action could be behaving completely differently to m5 price action, m5 price action could be behaving completely differently to h1, and so on. if bars are red on each timeframe, then there is what i say is "confluence", because the close prices are agreeing on that direction.
usage:
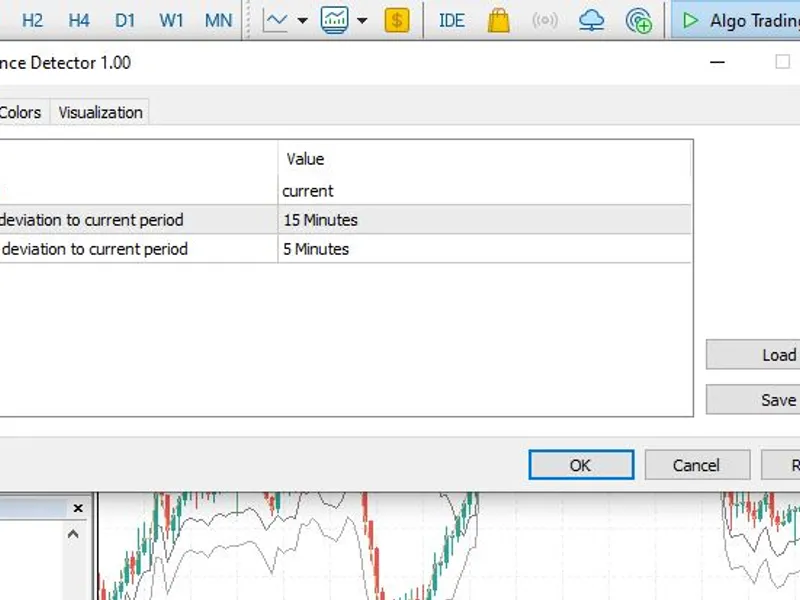
the current timeframe must be higher than the other two timeframes chosen in the input. see screenshot closely as an example.
example:
tf 1 (current): m30
tf 2 (deviator): m15
tf 3 (deviator): m5
six m5 bars and two m15 bars are tested against the m30 bar close price direction. the lower timeframe close prices are
within
the m30 time block, so naturally the lower timeframe bars will complete first and update the deviator plots on the current, higher timeframe.
these close prices on the lower timeframes cause the line plots to warp based on where the bars close (every timeframe bar has a closing price). the data is recorded when both the bars are open (current), and closed (historical), so the ticks of current unclosed bars are taken into account.
visually, it works as a trend indicator, but it must be noted that this is not not a tick indicator as historical data is based on ohlc - the resulting visual plot is based on where bars finally closed.
the word "confluence" in this context, is to examine if the close prices on different timeframe bars are harmonious (similar) with respect to the timeframes chosen. if there is a lot of noise and volatility, then it will record this by means of line expansion (lines moving away from each other), and if the close prices are agreeing (similar), it will record that by means of line contraction (lines becoming closer to each other).
You may also like: asq divergence detector - excellent alternative for indicator users on MetaTrader 5.
Source Code
#property copyright "robotfx"
#property version   "1.00"
#property indicator_chart_window
#property indicator_buffers 5
#property indicator_plots   3
#property indicator_type1   draw_line
#property indicator_color1  clrburlywood
#property indicator_style1  style_solid
#property indicator_width1  1
#property indicator_type2   draw_line
.......
⚠ Limitations & Risk Warning
- This tool is provided for educational and testing purposes only.
- Past performance does not guarantee future results.
- Trading involves substantial risk of loss. Use on a demo account first.
- Results may vary depending on market conditions, broker, and settings.
- We recommend thorough backtesting and forward testing before using with real funds.