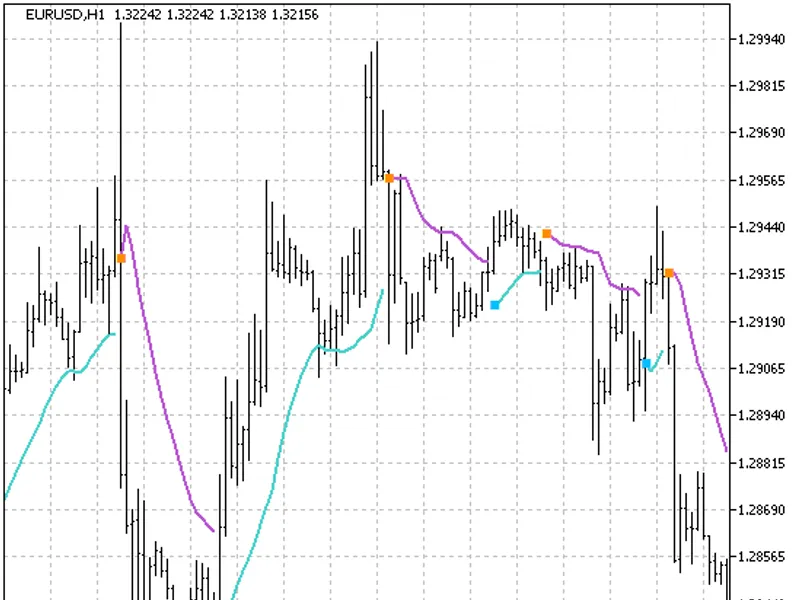
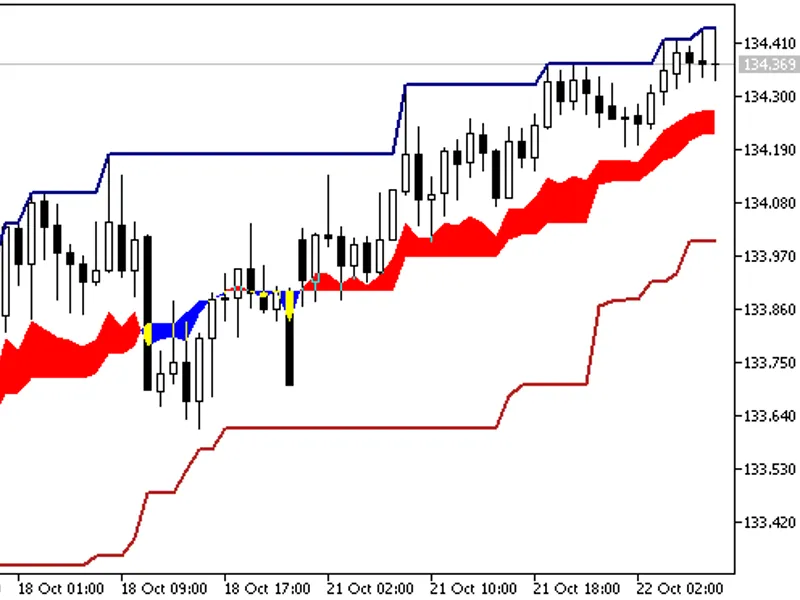
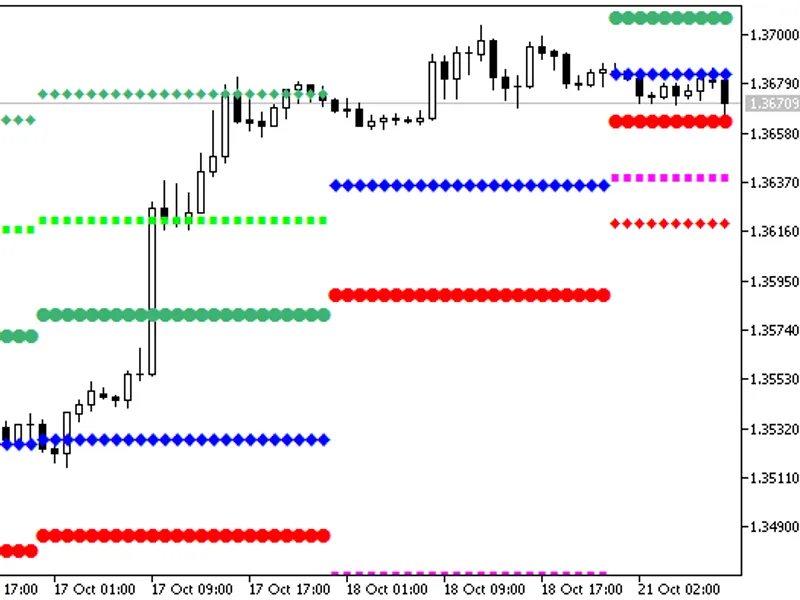
A simple and effective indicator, suitable for MQL5 beginners.This indicator was initially developed for MQL4 and released on April 4, 2008.Figure 1. The Gann_Hi_Lo_Activator_SSL i...
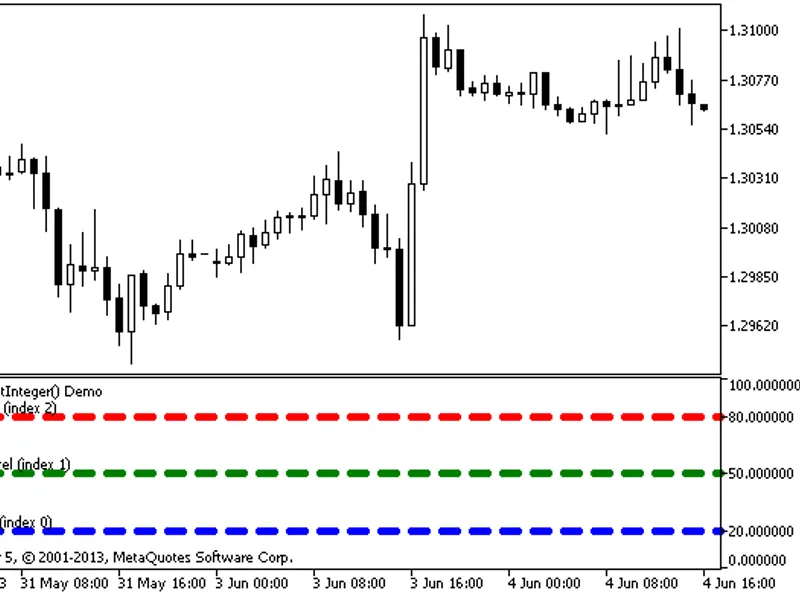
An example demonstrating how to create an indicator that displays labels for each horizontal level, such as "overbought level".This indicator is designed to be drawn in a separate ...
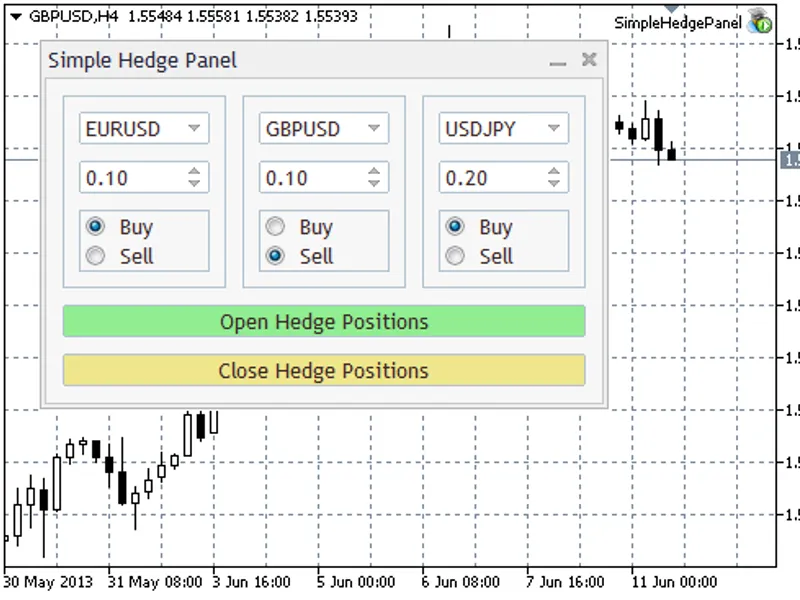
Simple Hedge Panel
The panel is designed for manual trading and allows you to open and close positions on multiple instruments. It includes the minimum required parameters such as...
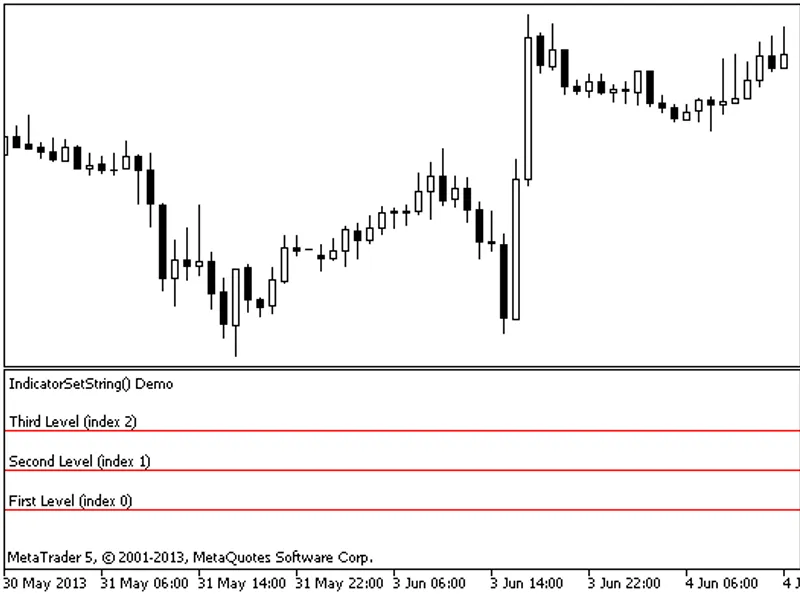
A straightforward indicator demonstrating how to create labels for each horizontal level, such as 'Overbought Level'.This indicator, designed to be displayed in a separate window, ...
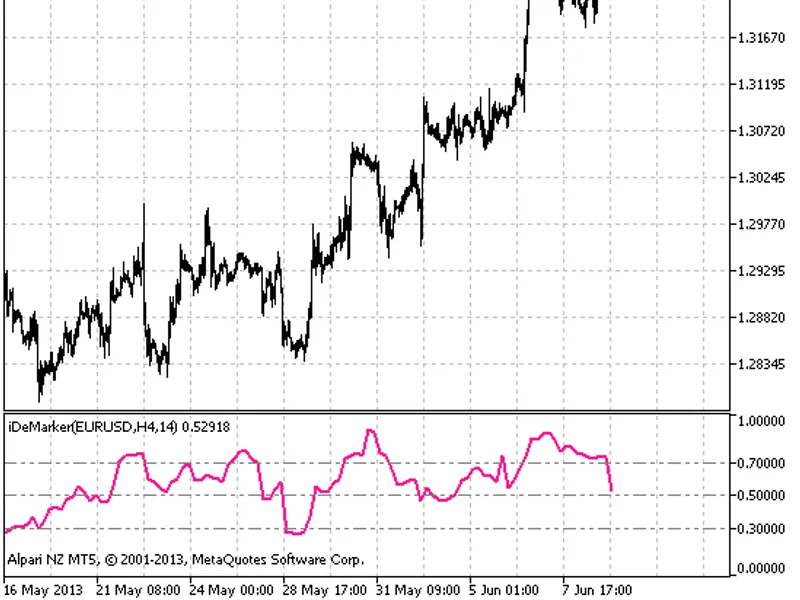
DeMarker HTF IndicatorThis indicator provides an option for setting a fixed timeframe for its calculation within the input parameters.This indicator was originally implemented in M...
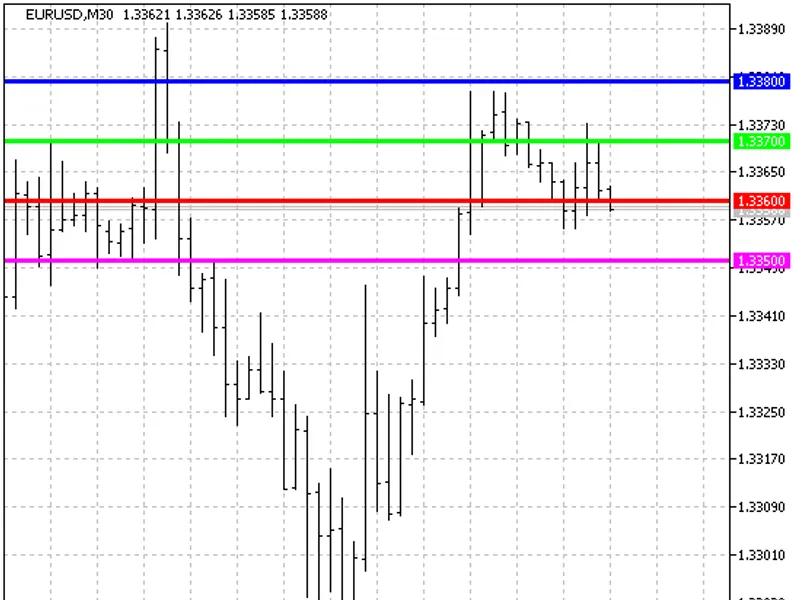
Many traders consider round price levels, which are levels where the price ends with two zeros (e.g., 1.5800, 1.5900), as significant support or resistance areas. The Round Levels ...
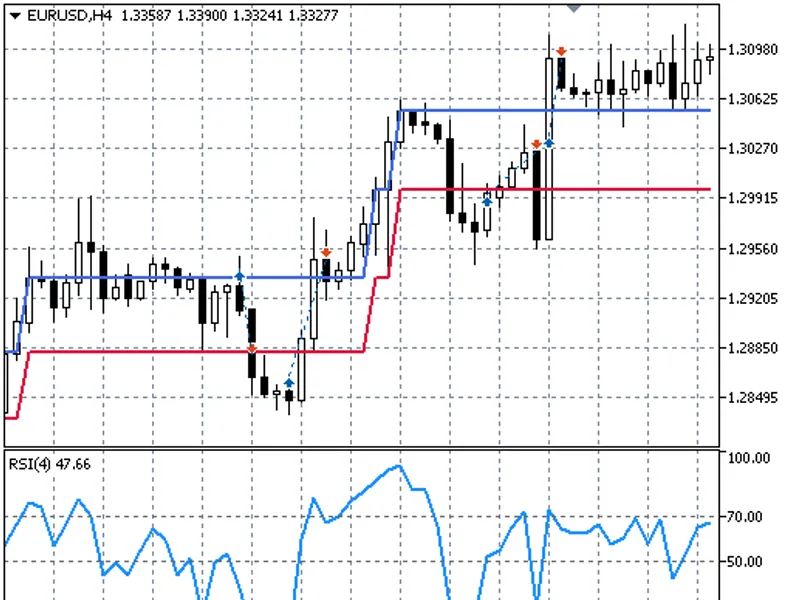
This Expert Advisor (EA) combines Renko Line Break for trend direction with RSI signals for entry and exit.The core idea is to identify the trend direction using Renko Line Break. ...
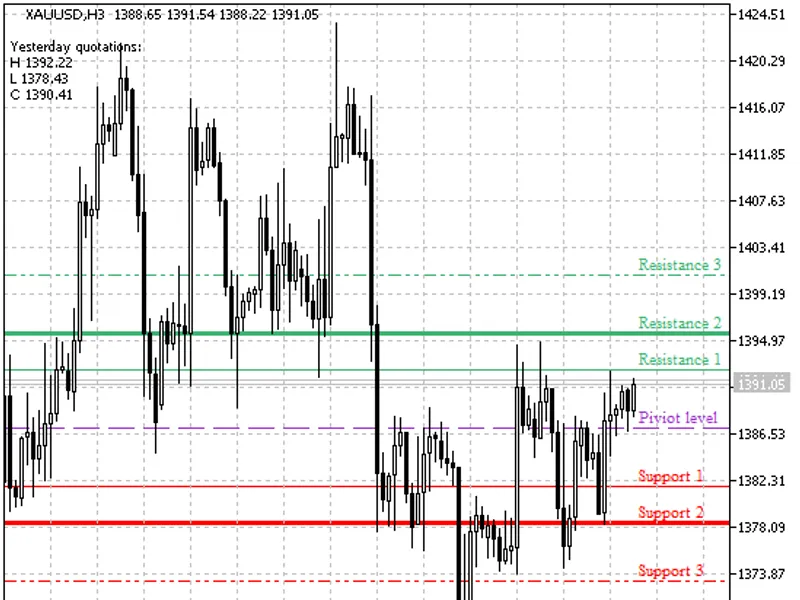
Fibo Pivot IndicatorA pivot point indicator incorporating Fibonacci levels, calculated using daily candlesticks.This indicator was originally developed for MQL4 and released on Mar...
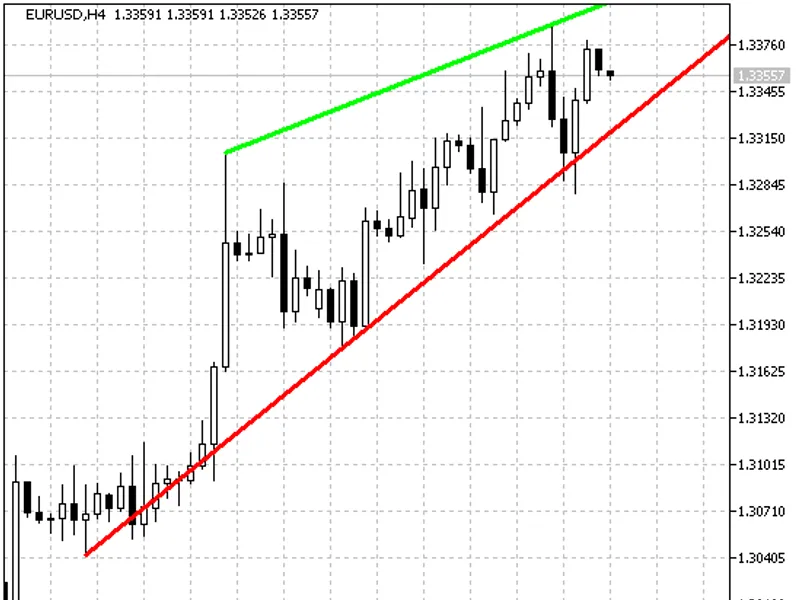
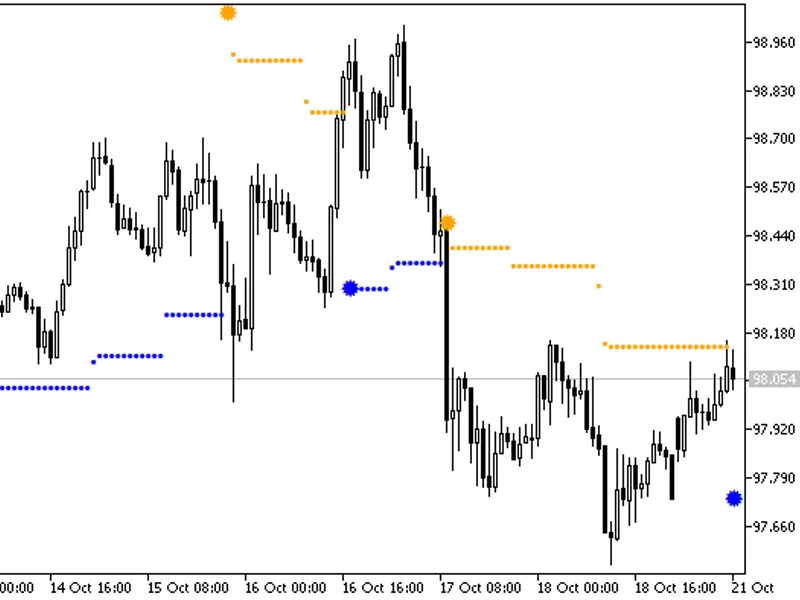
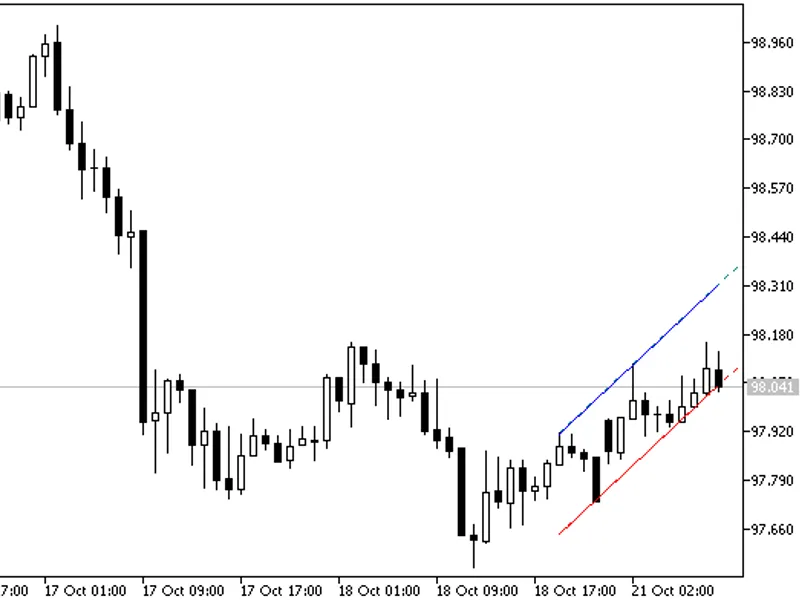
nsi2000The indicator draws two trend lines based on the closest price extremes.This indicator was first implemented in MQL4 and published on 28.03.2026.Figure 1. The TrendChannel I...
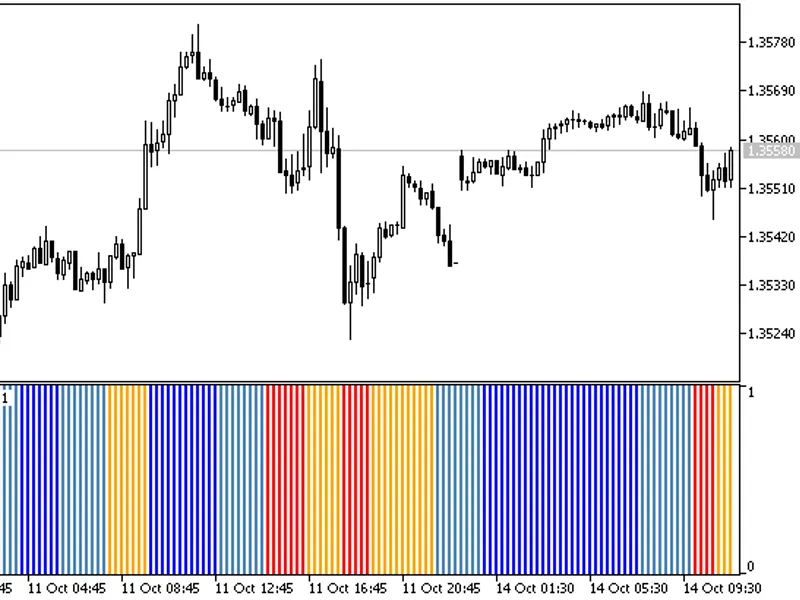
A trend indicator with four states.
This indicator provides an option for selecting a source indicator for detecting trend using the triggertype input parameter. Available options ...
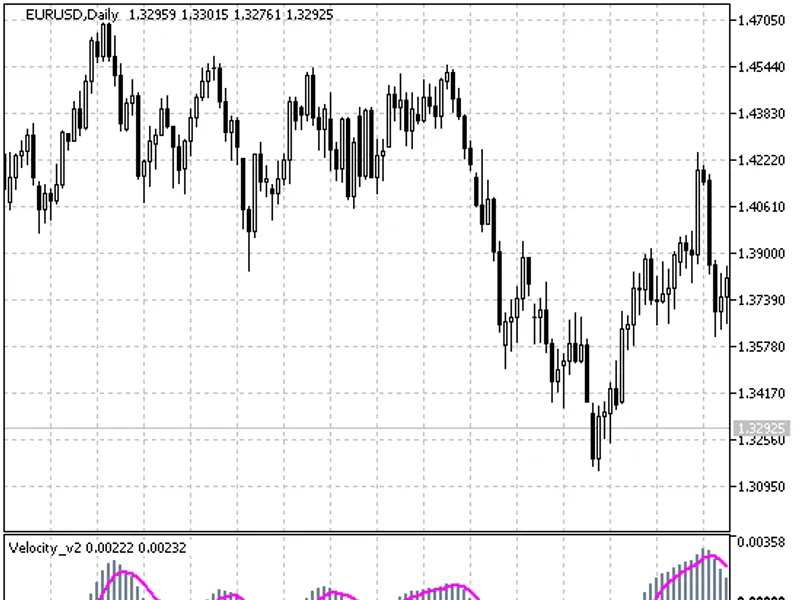
Velocity is a momentum oscillator that features triple averaging and a signal line.The triple averaging is employed to filter the indicator's direction.This indicator was originall...
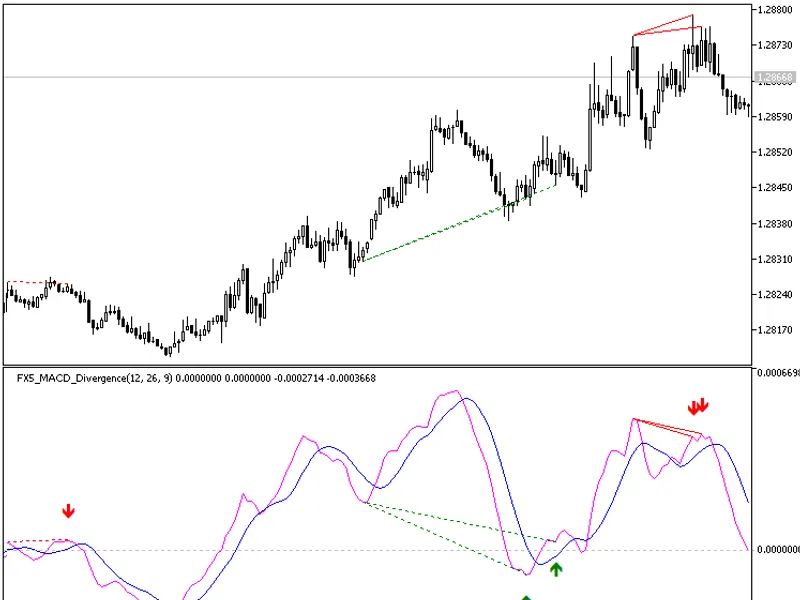
This indicator plots divergence lines on the MACD indicator and provides buy and sell signals with green and red arrows.It includes a built-in alert function.Bullish divergences ar...
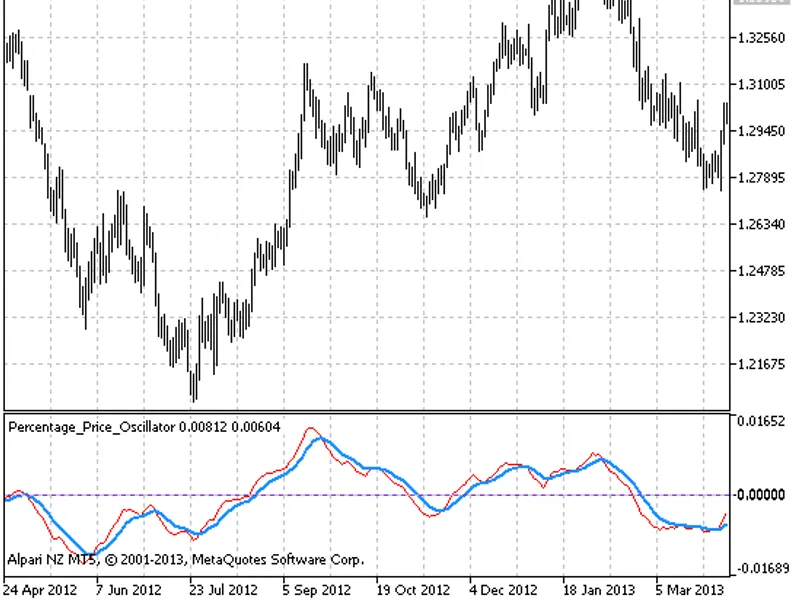
A non-normalized oscillator. The indicator is calculated using the following formula:It shows more accurate signals of divergence between the price and the value of the oscillator;...
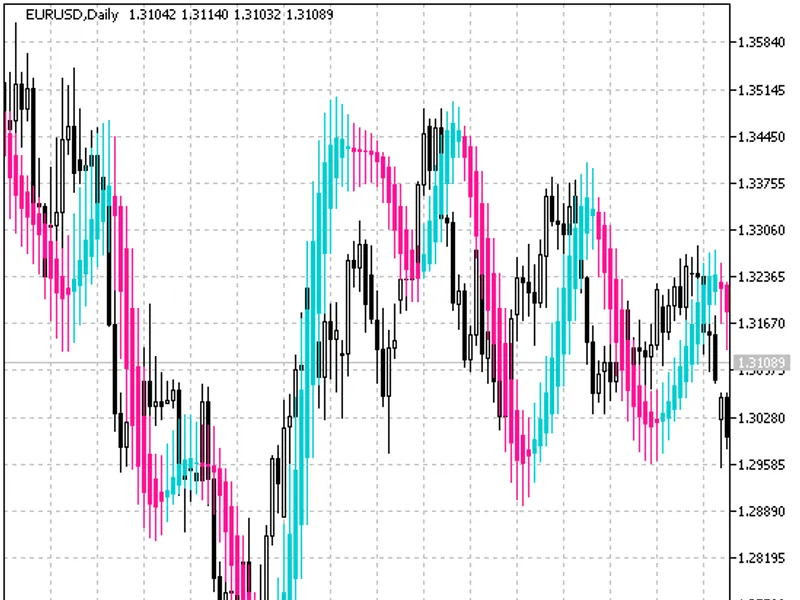
The Hull Candles indicator is a candlestick-based indicator that utilizes the Heiken Ashi algorithms and two averages.Indicator OverviewThe indicator was first implemented in MQL4 ...
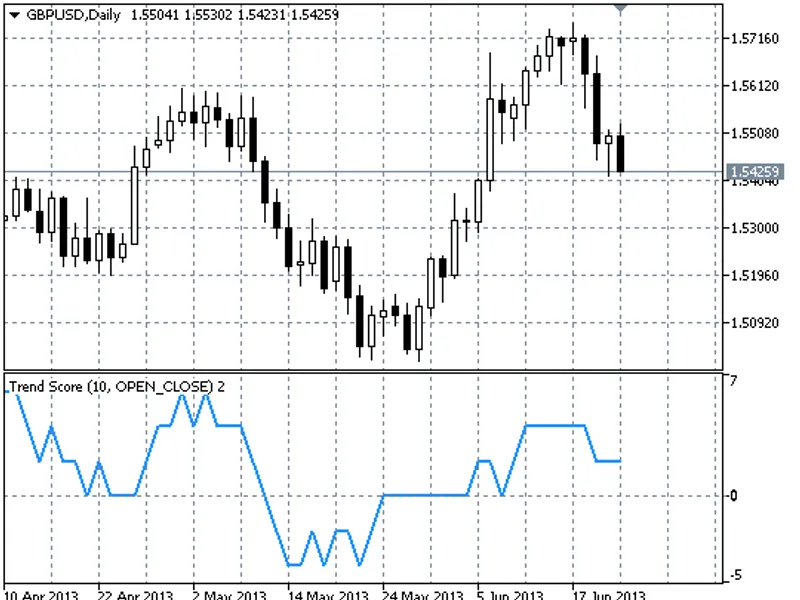
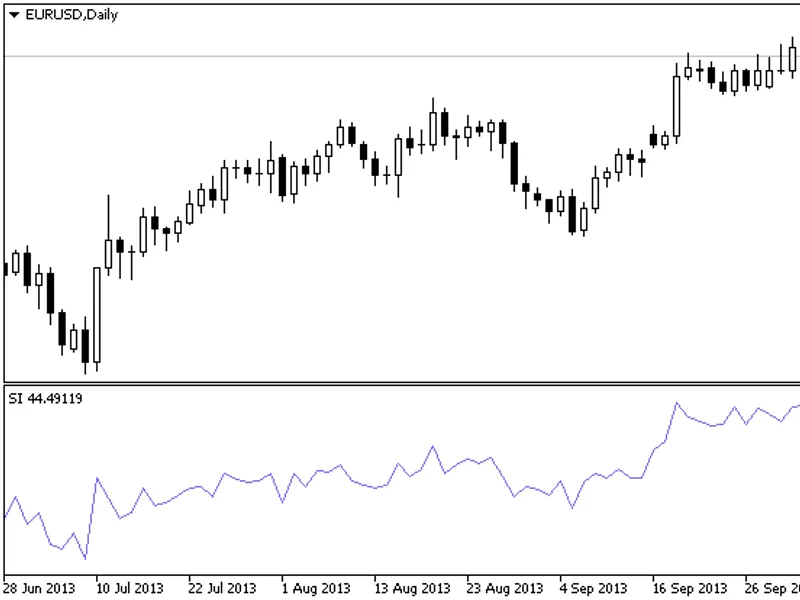
The trend score indicator can be calculated in two ways: with a specified period and without a period. When a period is used, the trend is determined by comparing the current price...
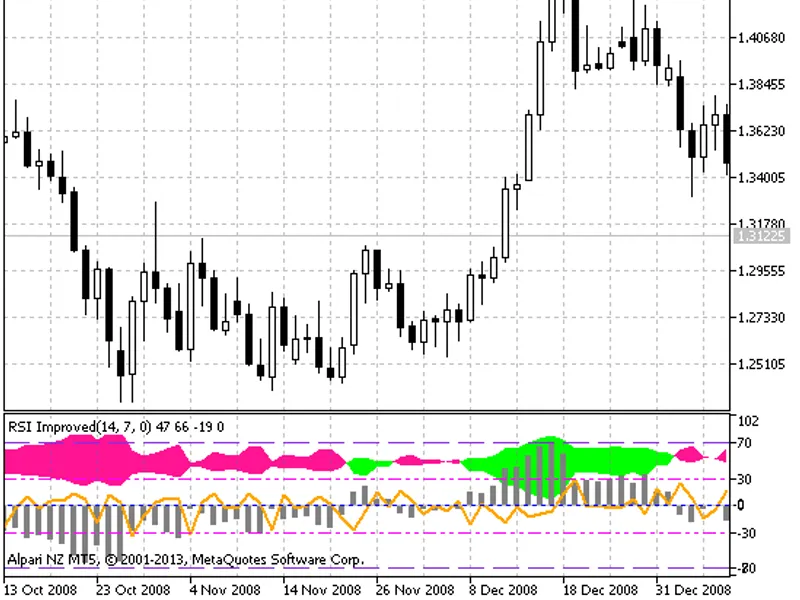
This is a combined indicator, built on the basis of two RSI oscillators.Indicator DescriptionThis indicator calculates the value of the RSI indicator with the RSI period and the va...
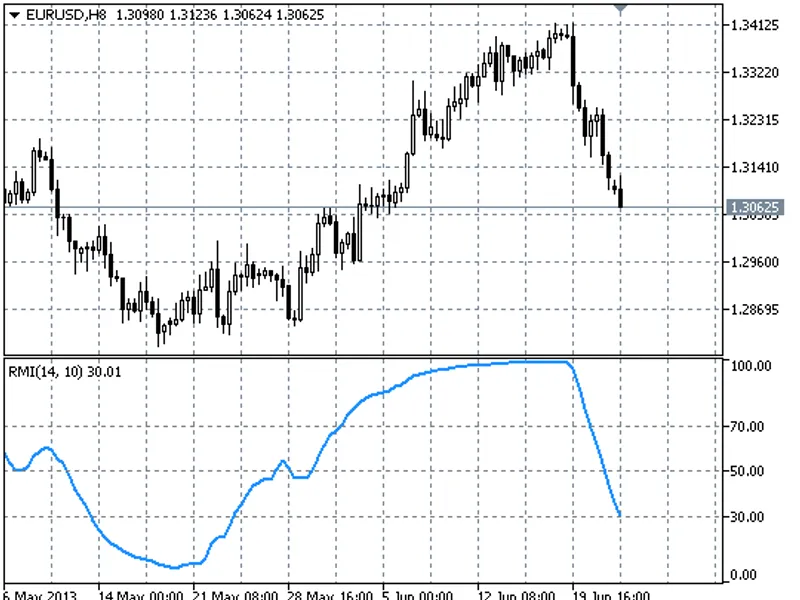
The Relative Momentum Index (RMI) is a technical indicator that calculates the momentum of price changes over a specified period.
It differs from the Relative Strength Index (RSI) ...
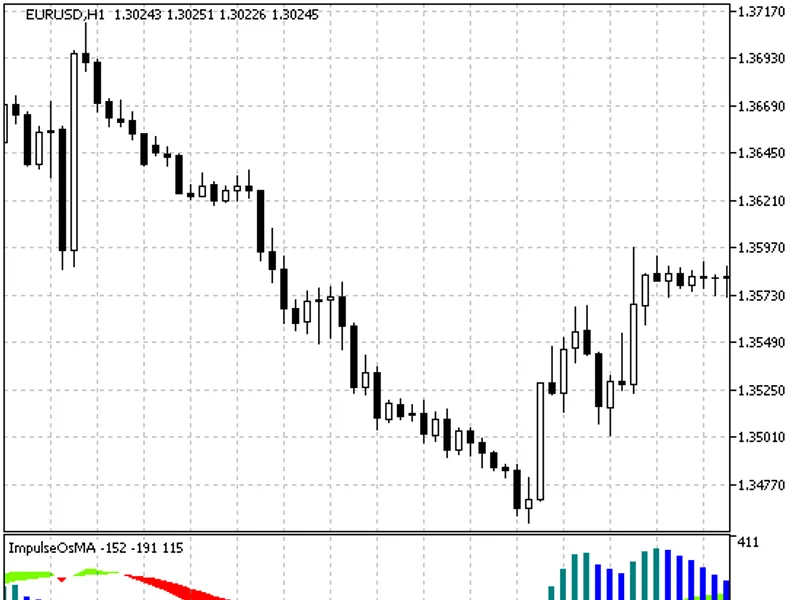
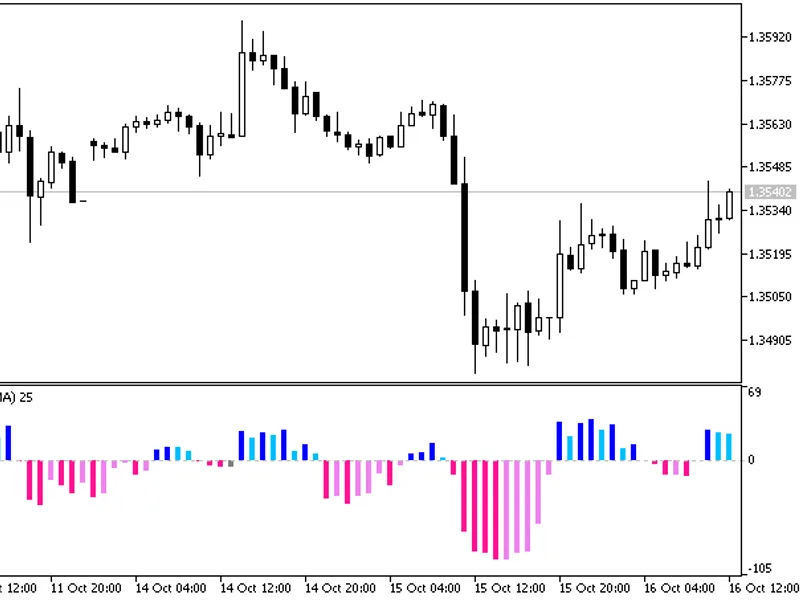
Impulse OS MAThis indicator is a hybrid of MACD, MACD Histogram, and the Impulse System.The histogram bar is colored green when both the histogram and the price chart MA are increa...
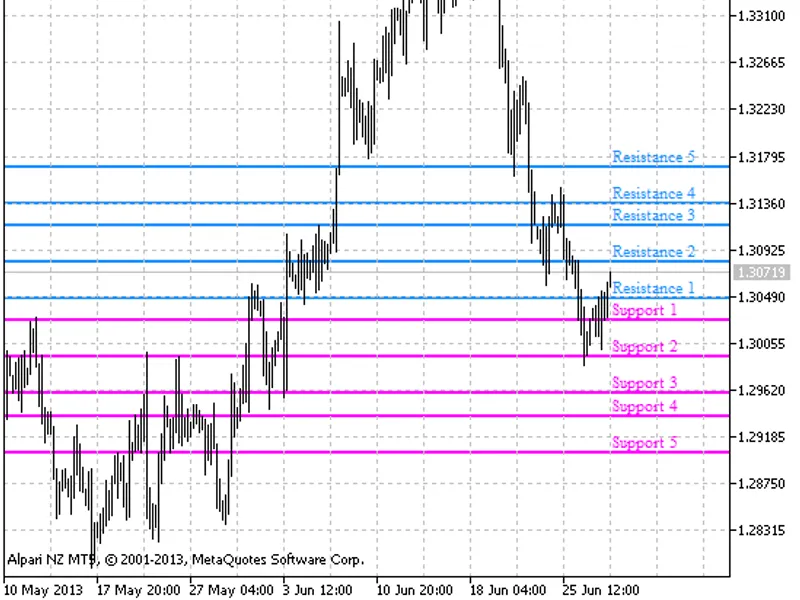
This indicator determines dynamic support and resistance levels using Moving Average lines and statistical lines calculated on a higher timeframe.The calculation method is based on...
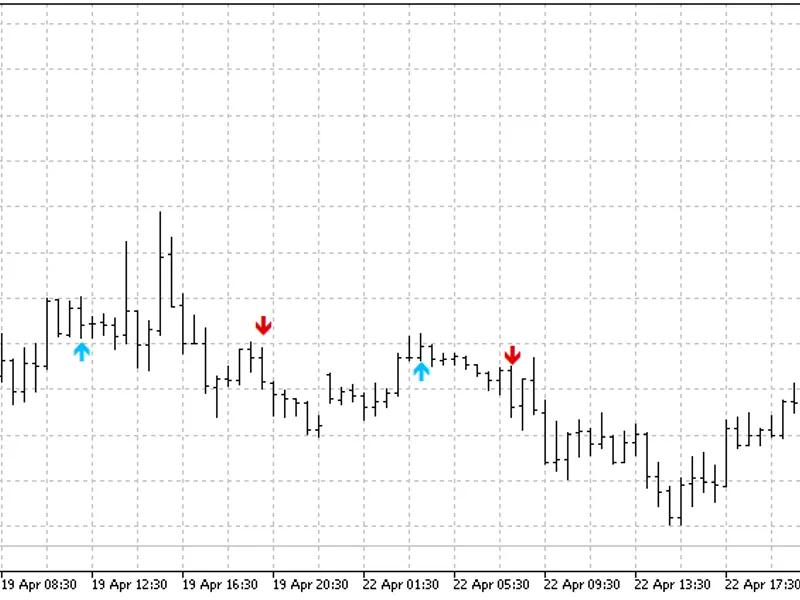
The Three Screen Elder Arrows Indicator is based on the Elder's Triple Screen trading system. It utilizes three distinct timeframes: a higher timeframe, a medium timeframe, and a l...
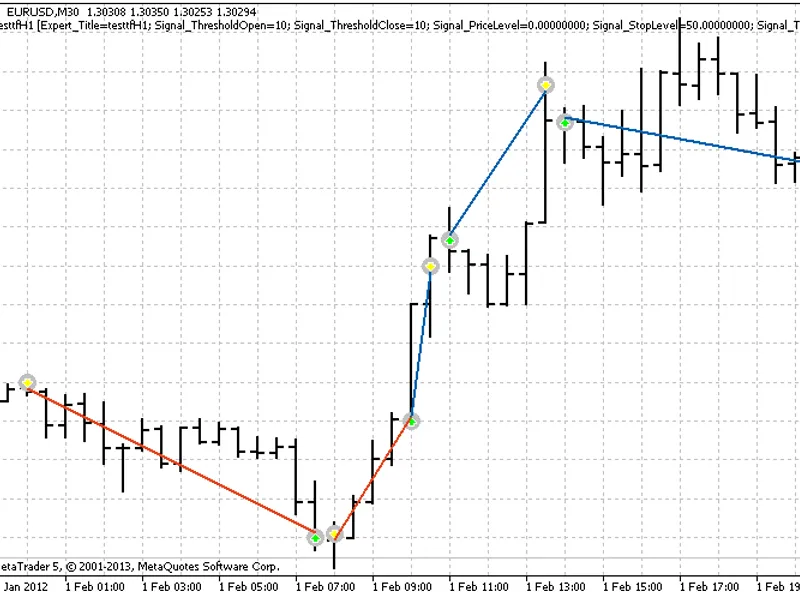
This script enhances the visual display of graphical objects generated by the Strategy Tester, facilitating easier analysis of trading results.It allows for modification of line pa...
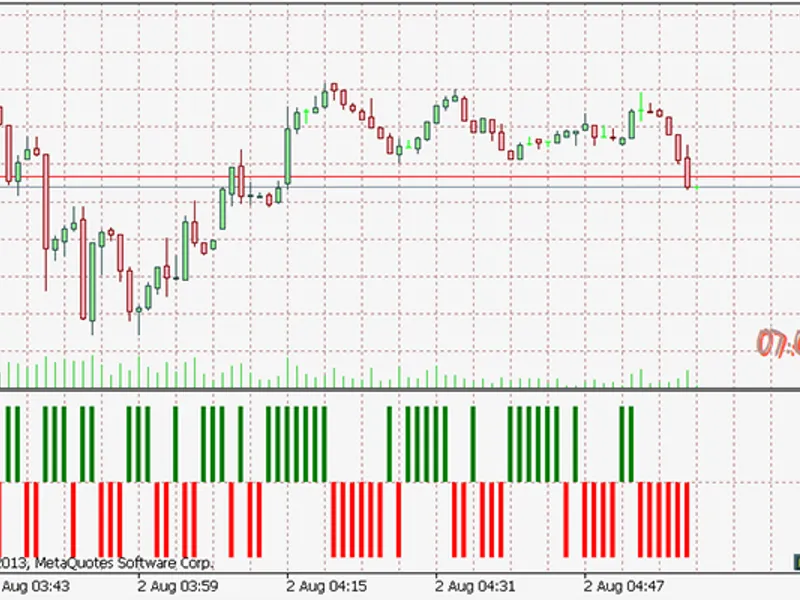
This indicator facilitates the quick assessment of the impact of the spread on the cost-effectiveness of strategies that predict market behavior one bar forward.It is particularly ...
This script allows for rapid cycling through your open charts using a single hotkey. Assign the script to a convenient key combination to quickly switch between trading setups and ...
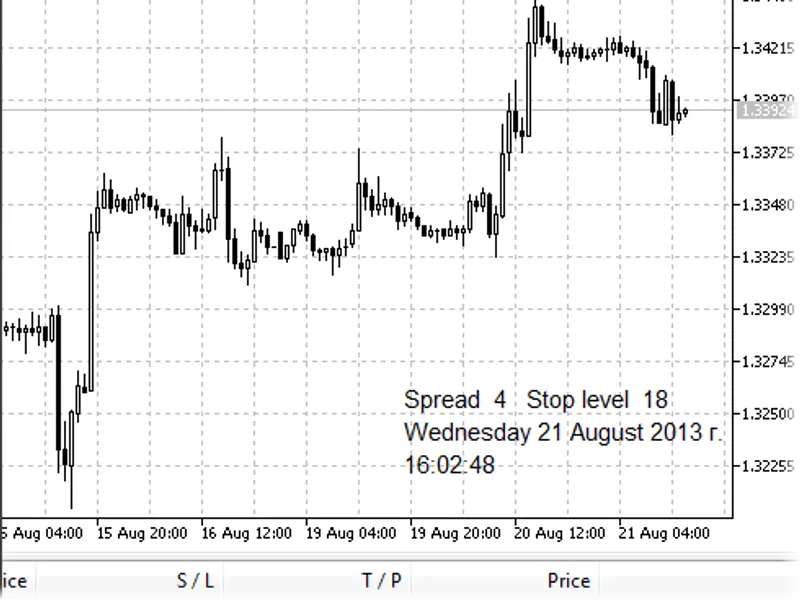
This indicator displays the current date, time, spread, and stop levels on your MetaTrader charts.Key Features:- Time Display: Choose between local (trader's computer) time or serv...
This script calculates and displays statistics for candlestick bodies and shadows on the current chart. The statistics include minimal, maximal, and average values, presented for t...
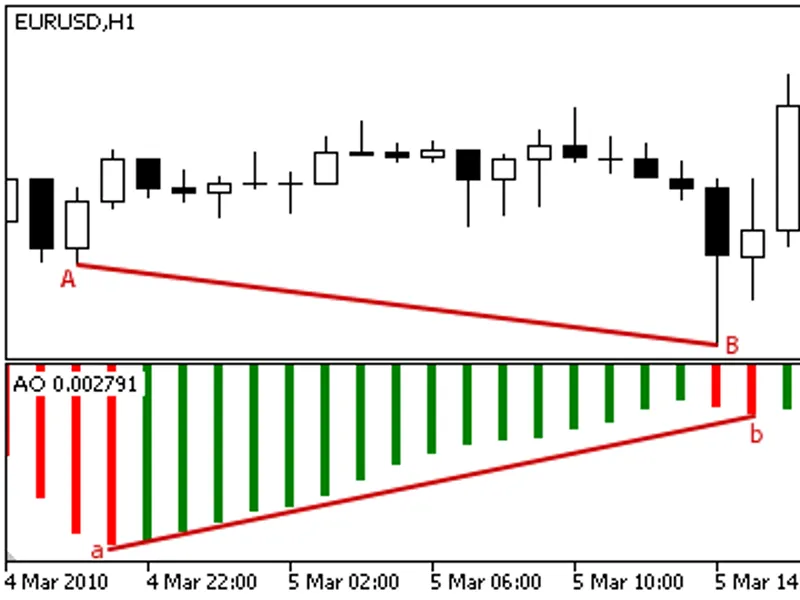
This indicator plots divergence lines on the Awesome Oscillator and provides buy and sell signals with arrows.Bullish regular divergence is shown in solid blue lines.Bullish hidden...
Inverse Reaction EA is an automated trading algorithm based on the principle that significant price changes are often followed by an opposing movement.Parameters:The following para...
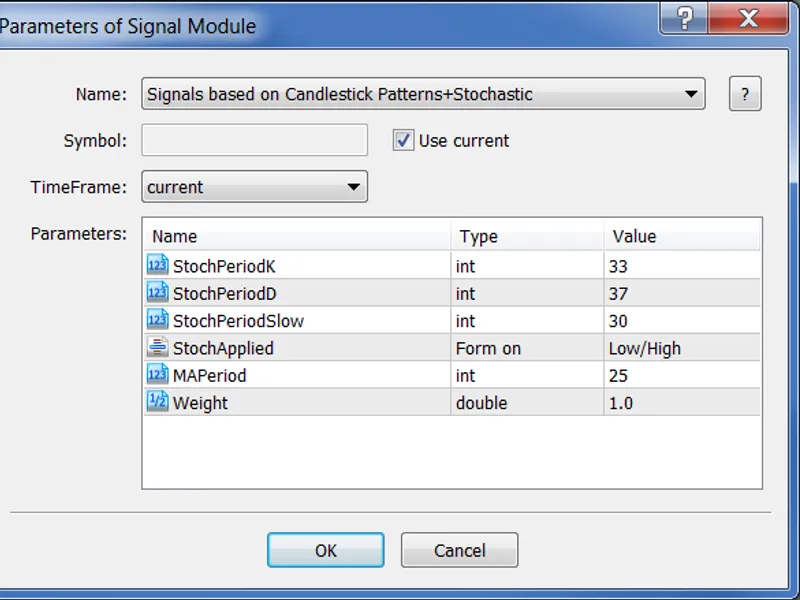
Traders can now leverage trading signals based on trading signal classes, position tracking, and money management.With the standard library, you can develop and test your own tradi...
Filter over WPR Indicator
This is an indicator of trend power with four distinct states, utilizing the WPR (Williams Percent Range) as its source for signals. A strong upward tren...
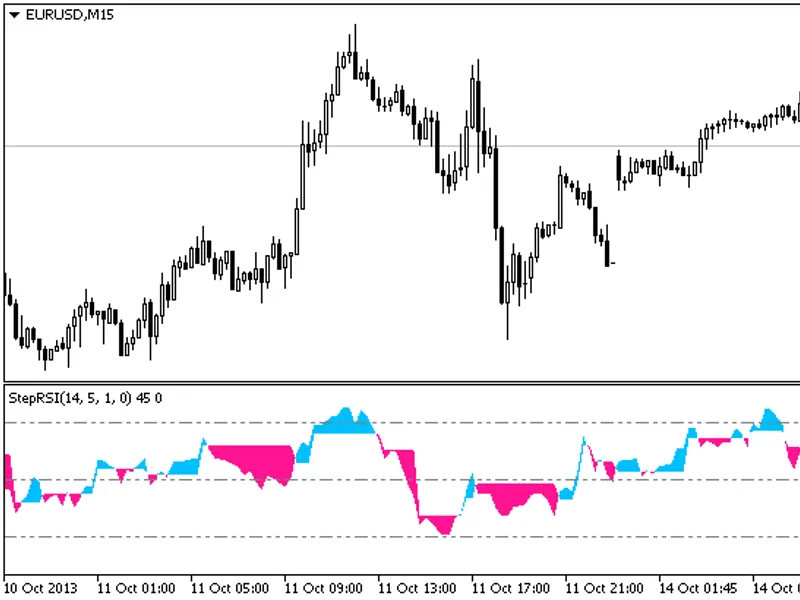
A trend indicator that utilizes the oscillator analogue of RSI and its signal line. It is visually represented as a colored cloud.This indicator was initially developed for MQL4 an...
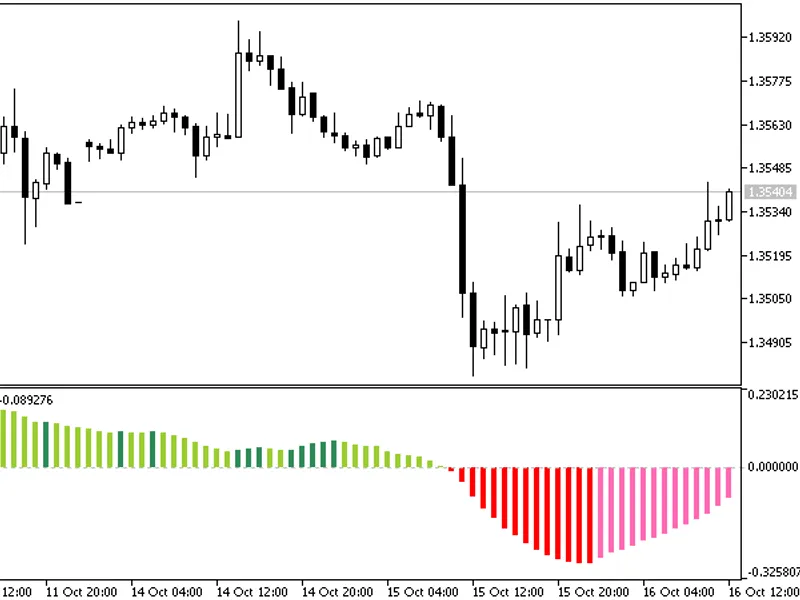
A smooth, non-normalized oscillator presented as a color histogram.This indicator addresses how to identify trend changes, select appropriate flat market conditions, and execute tr...
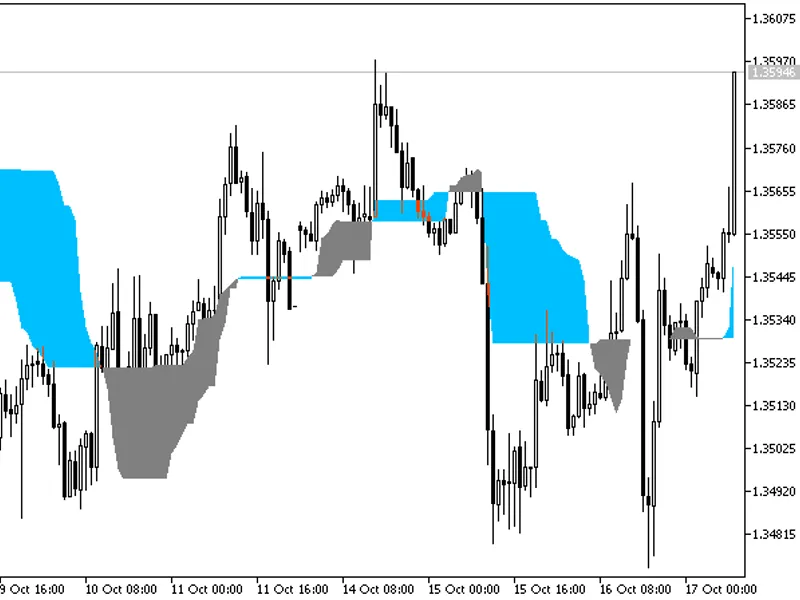
The Chande Kroll Stop is an indicator that visualizes trend strength using a colored cloud. A strong trend is depicted in blue, while a weak trend is shown in gray.This indicator w...
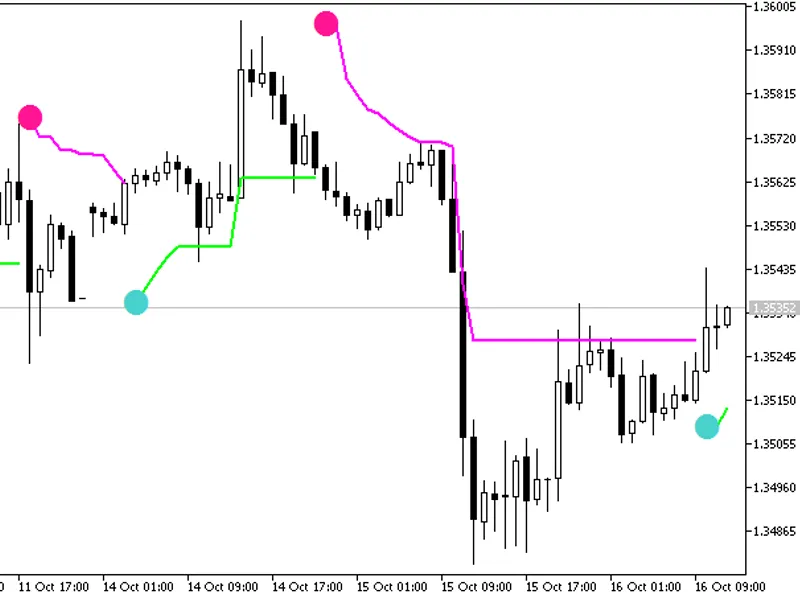
The Chandelier Stops indicator is a trend indicator implemented in the form of NRTR (Trailing Stop).This indicator was first implemented in MQL4 and published on 02/20/2026.Figure ...
The QStick indicator is a simple n-period moving average of the price difference.QStick can be used as a simple replacement of candlesticks. Positive values of QStick indicate a pr...
A trend indicator based on the crossover of a pivot level and its median.The pivot level is calculated using the following formula:pl = (max + min + close) / 3Where:pl - pivot leve...
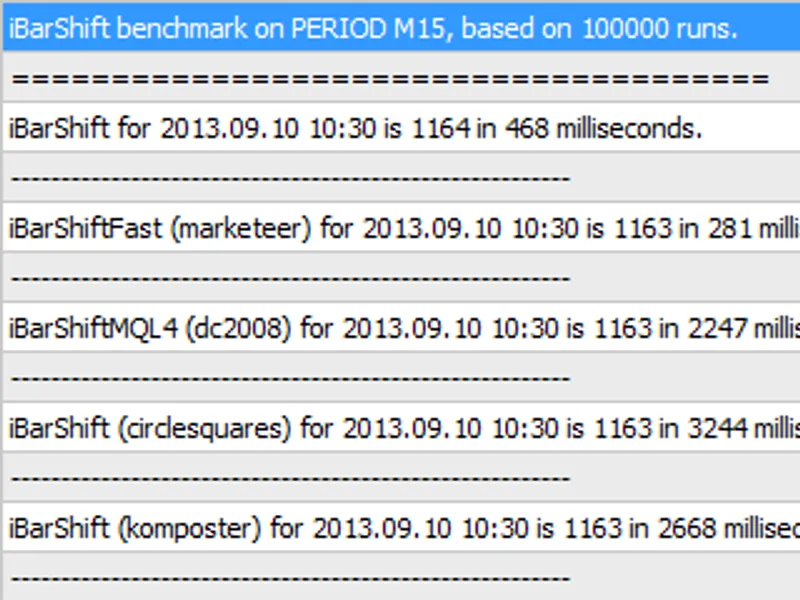
The iBarShift function, commonly used in MQL4, is not directly available in MQL5.MQL5 includes fundamental, low-level functions within its libraries that allow for the implementati...
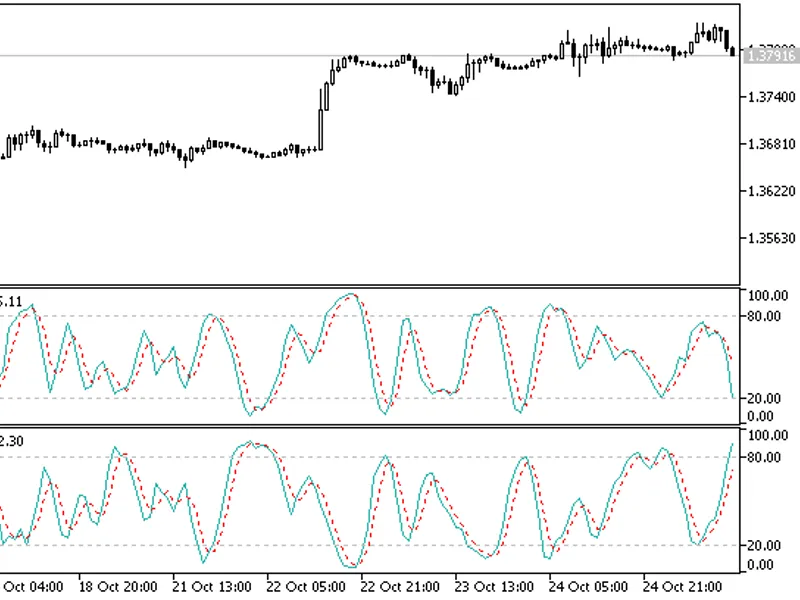
The Any Pair Stochastic Indicator allows you to display the Stochastic indicator for any chosen symbol on your current chart.This provides greater flexibility than standard indicat...
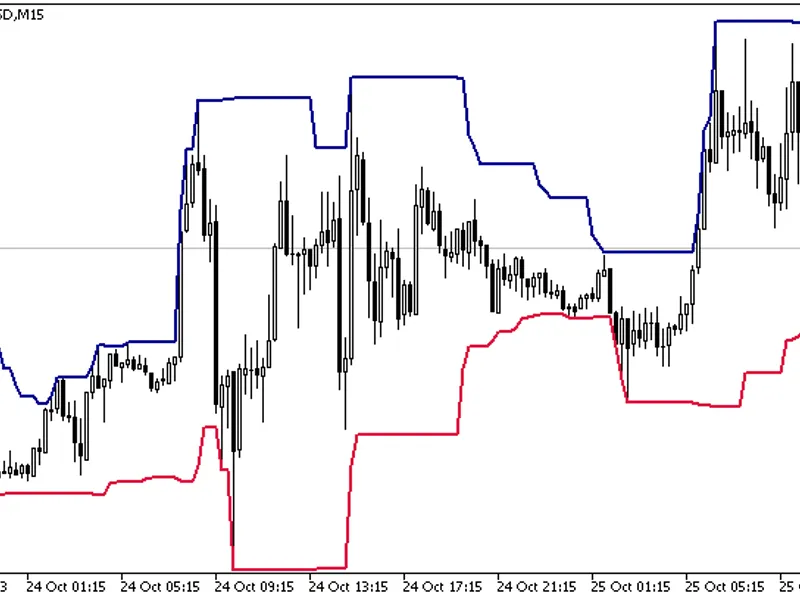
Donchian Channel is a volatility indicator based on the calculation of the current price range with the recent highest and lowest prices.Key Features- The indicator calculates the ...
An example of a multicurrency expert advisor that uses a loop, where each iteration is responsible for trading each symbol separately.To avoid dependence on ticks of any symbol, th...
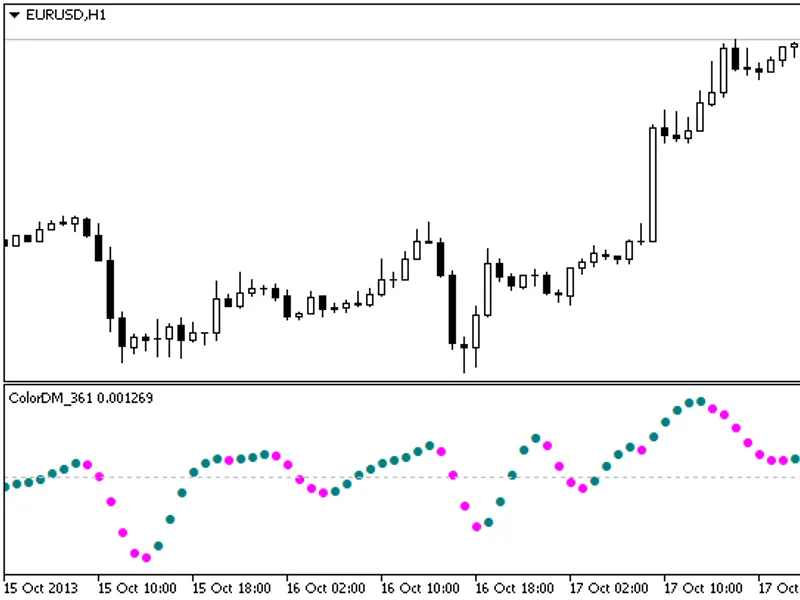
Finware.ru Ltd.A digital momentum indicator represented by colored characters.This indicator was first implemented in MQL4 and published on 11.02.2026.Figure 1. The ColorDM_361 Ind...
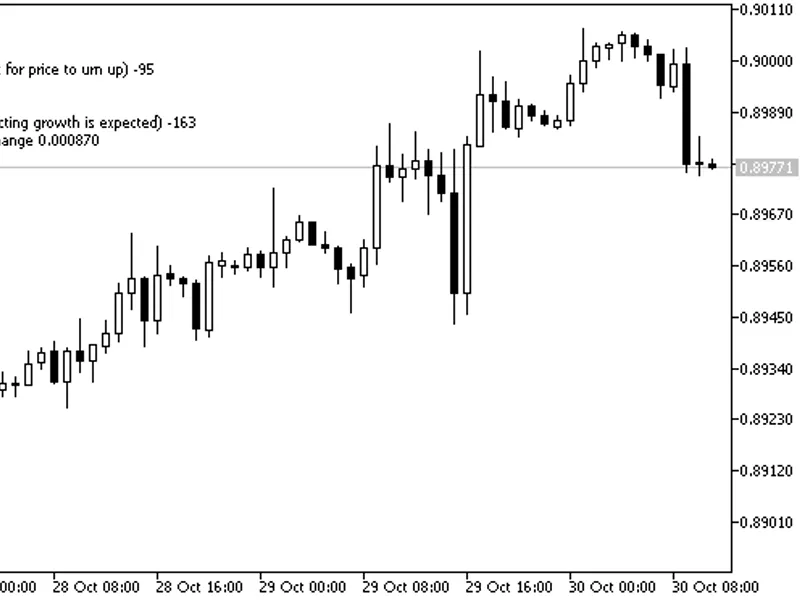
The Commentator Indicator analyzes a group of technical indicators and displays trade recommendations.This indicator was first implemented in MQL4 and published on 11.02.2026.Figur...
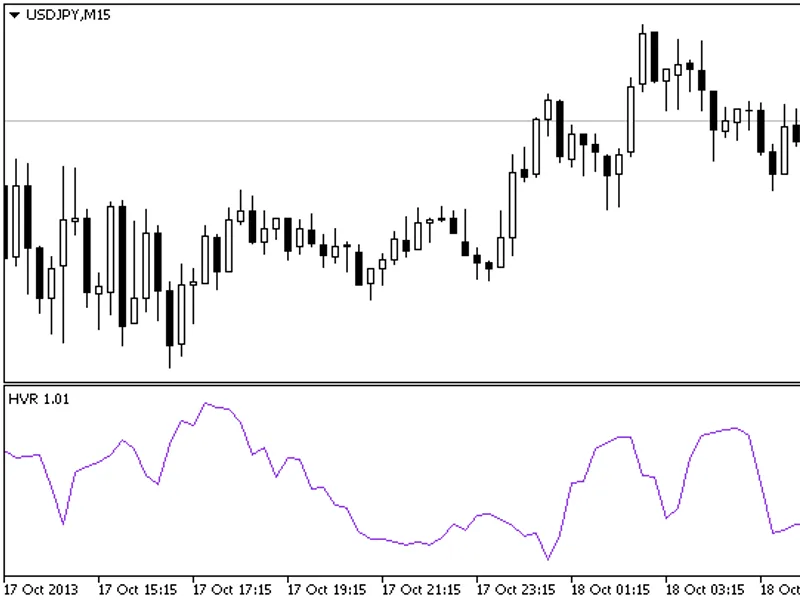
HVR IndicatorAn indicator of trend strength. The ratio of the price of the current bar to the price of the previous bar is used as the initial data for the calculation.This indicat...
I-Pass Lev CCI Indicator
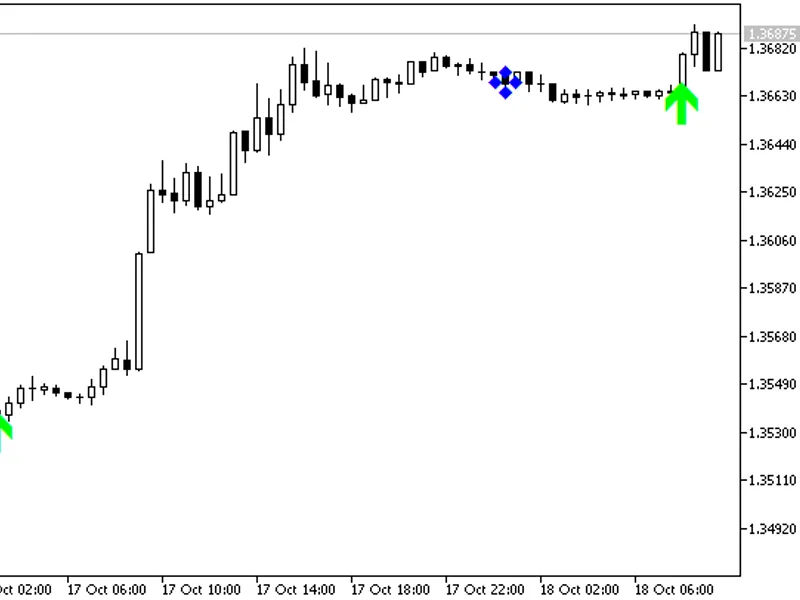
This indicator provides semaphore signals using an oscillator.
Entry signals are displayed on the chart as colored arrows.
Exit signals are indicated by...
The indicator displays support and resistance levels calculated on daily prices. Support and resistance levels are calculated by the following formulas:This indicator was first imp...
The NRTR Indicator using Technical Analysis.This indicator was first implemented in MQL4 and published on 26.02.2026.Figure 1: The BAT_ATRV1 Indicator...
i-sk b-f IndicatorBarishpolts' moving channels indicator.This indicator was first implemented in MQL4 and published on 09.02.2026.Figure 1. The i-skb-f indicator....
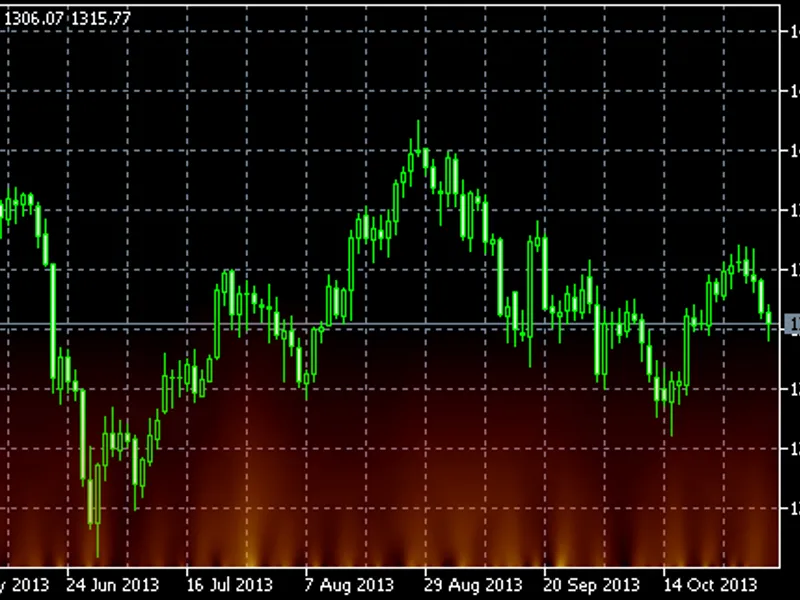
The Flame indicator displays gradient semitransparent areas with an independent update rate.This feature allows for dynamic and visually distinct representations of data within the...