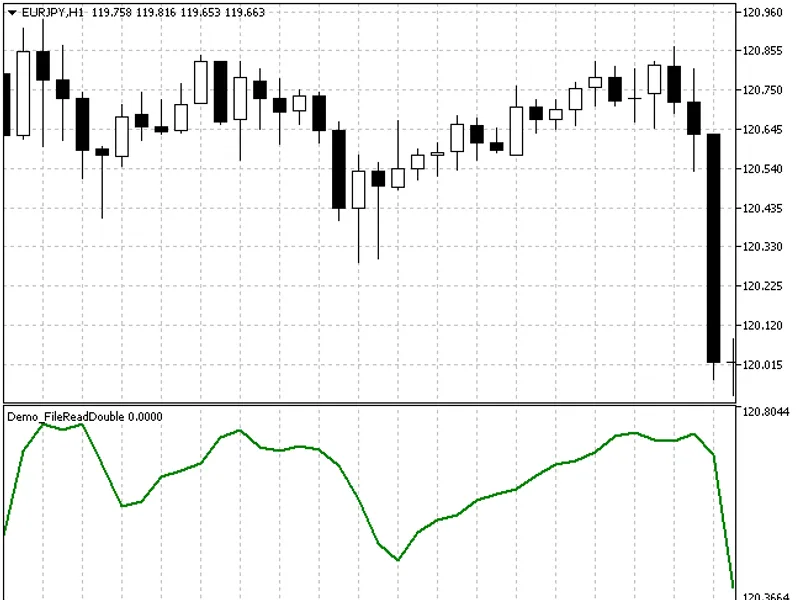
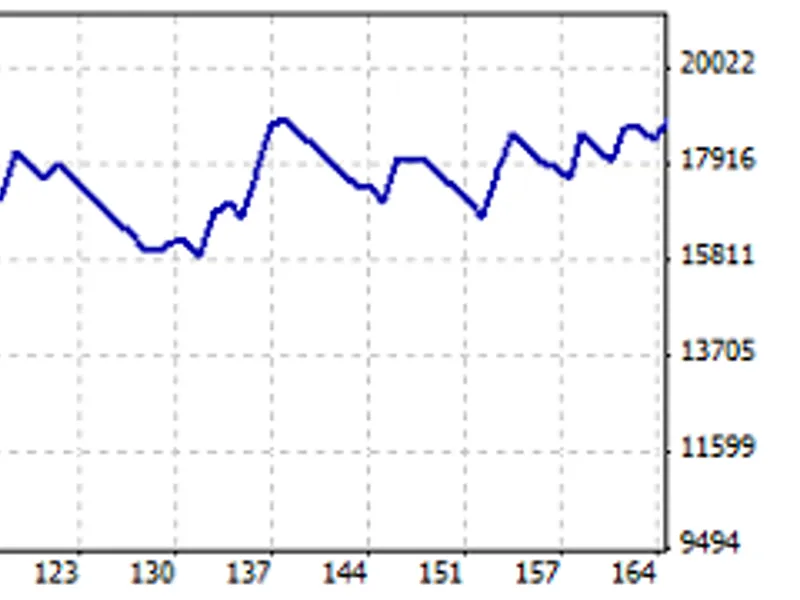
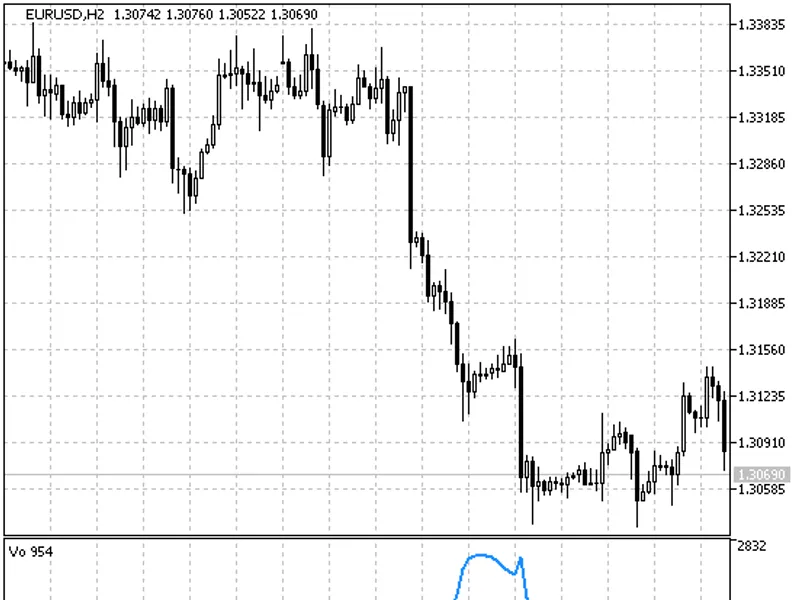
This indicator reads and displays data from a binary file in a separate subwindow.To use this feature, first run the script to generate the data file. The indicator will then displ...
This script efficiently organizes CSV files based on their sizes within the general folder of MetaTrader client terminals.The process involves:- Retrieving file sizes.- Comparing s...
The script opens a text file and analyzes the positions of strings' start points, displaying string text with a random number.To retrieve the array of start positions for each stri...
The script retrieves prices from a chosen symbol, analyzes the data, and writes price movement information to a binary file at specified intervals.The () function is responsible fo...
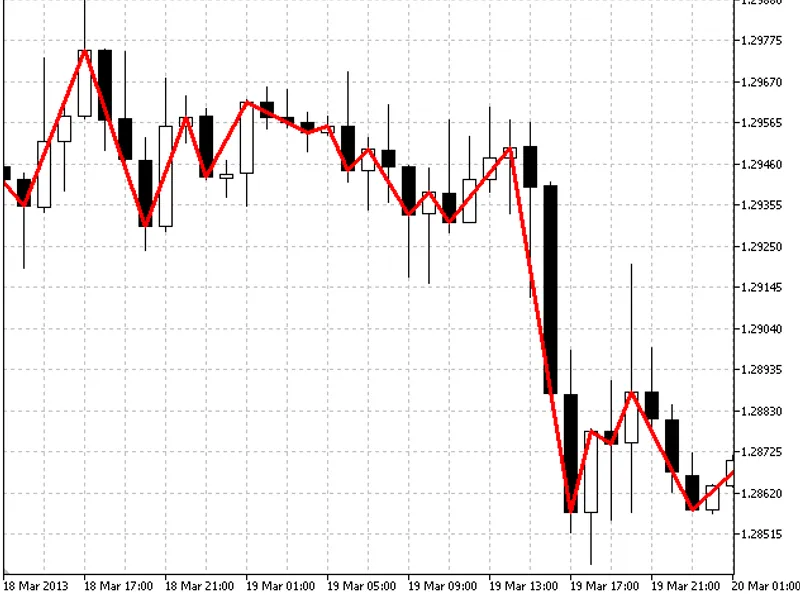
The indicator reads and displays price movement data from a file as a broken line in the chart's main window. To use this feature, you must first run the script to generate the dat...
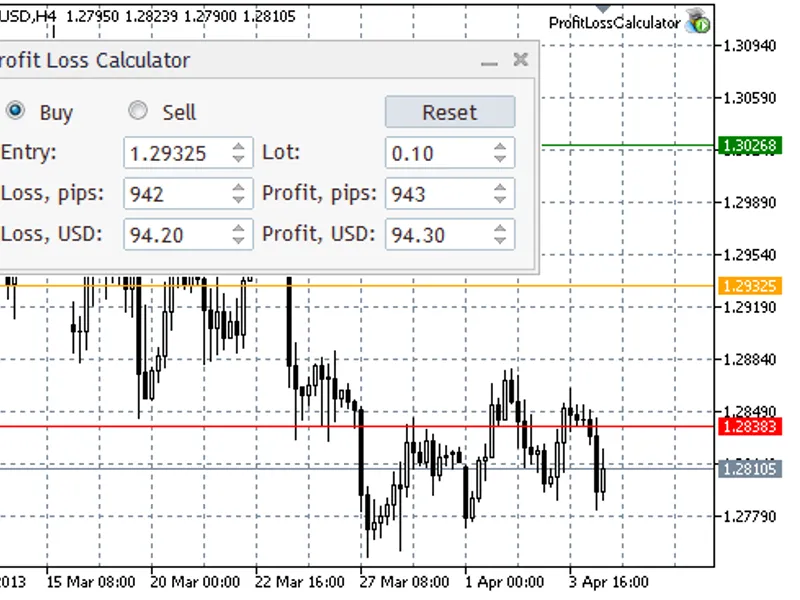
This panel is an adaptation of the 'calculateprofit_ea' expert advisor, designed for profit/loss calculation and visualization of stop loss and take profit levels.Features:- Radio ...
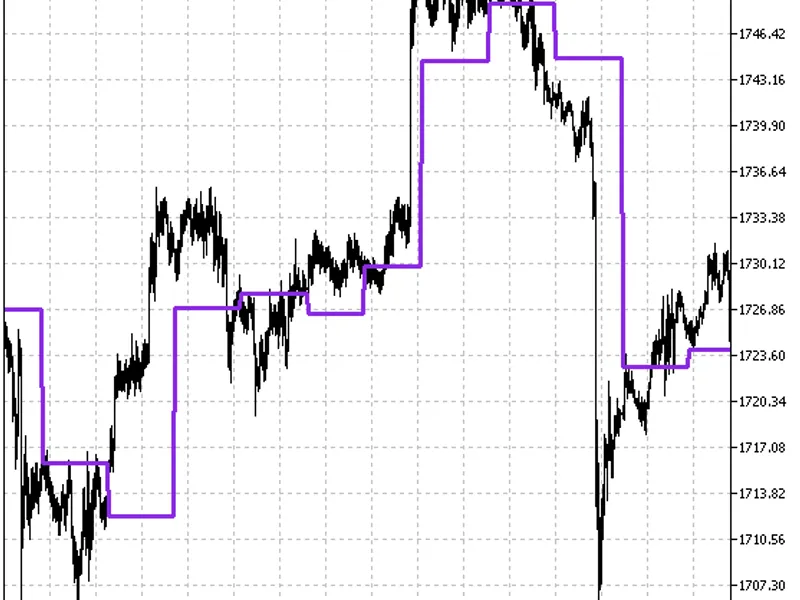
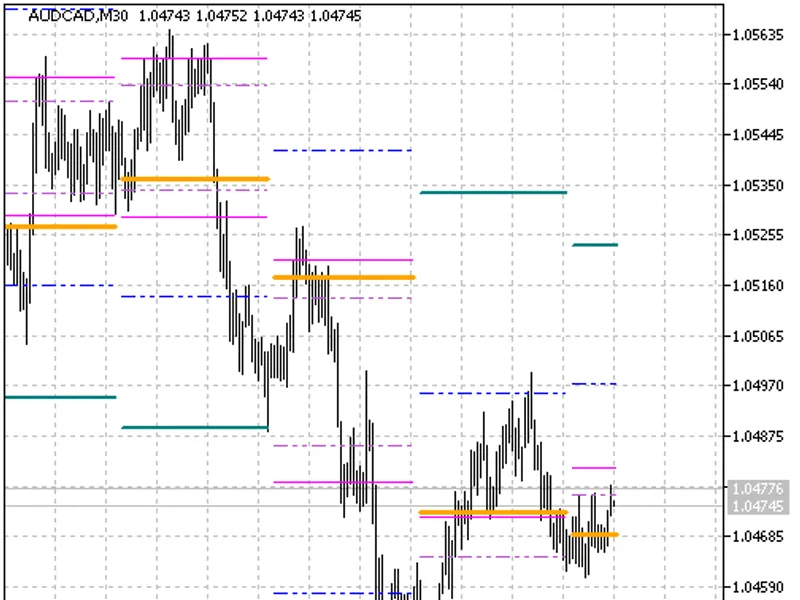
This indicator is a variation of the Reversed Pivot Points concept. It calculates and displays a pivot line based on daily chart values.The indicator's functionality:- Calculates a...
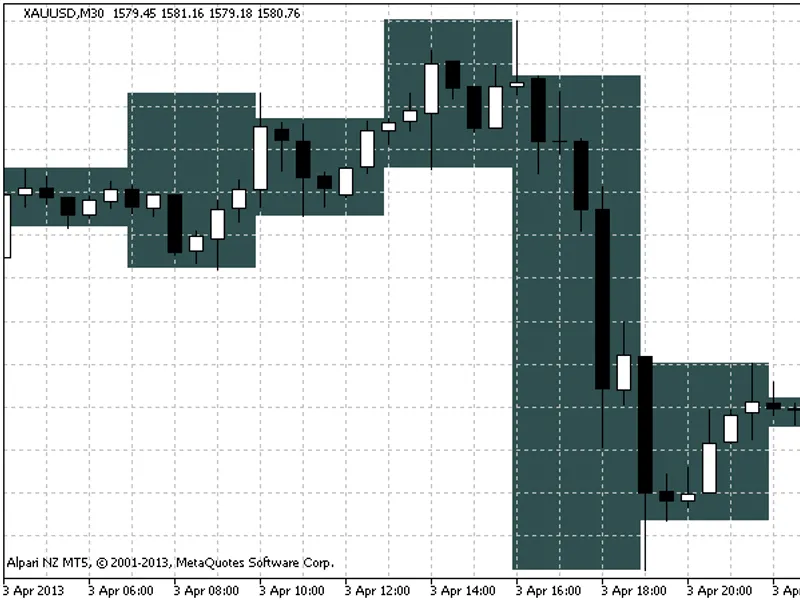
The i-Morning Range indicator is a powerful tool for traders using the MetaTrader platform.Indicator Input Parameters:This indicator was first implemented in MQL4 and published in ...
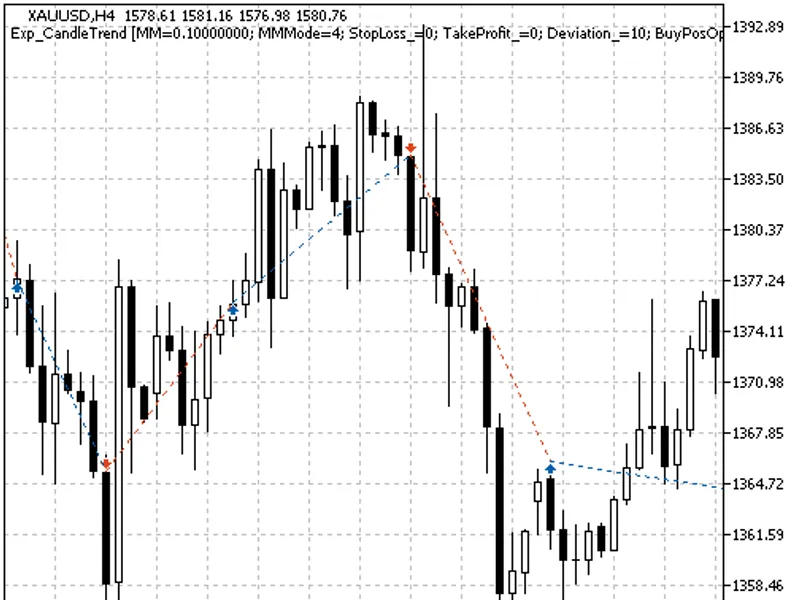
The Exp Candle Trend is a straightforward trading strategy that identifies entry points based on the occurrence of consecutive, directionally aligned candlesticks. Trading signals ...
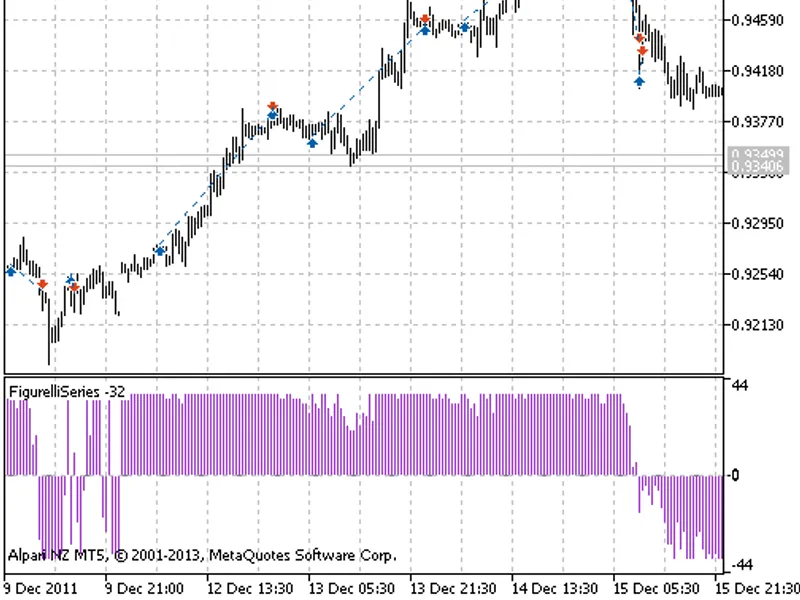
Trading system utilizing the trend indicator, with trade decisions made at specific time intervals. These intervals are determined by two sets of input parameters, one for opening ...
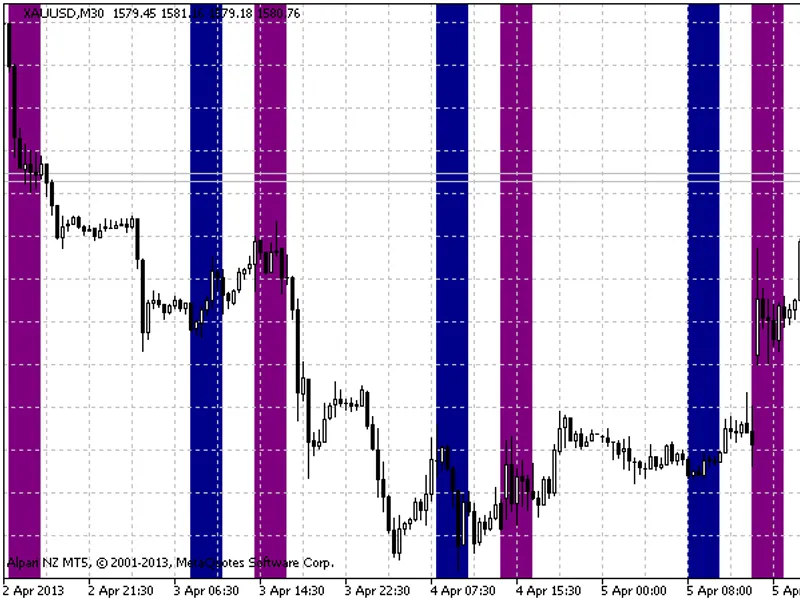
The i-paramonworktime indicator identifies the two periods of highest market volatility within a 24-hour window. These periods can be customized using the indicator's input paramet...
The i-Sessions indicator is a powerful tool for visualizing trade sessions. It highlights eight distinct trade sessions using colored rectangles, allowing traders to easily identif...
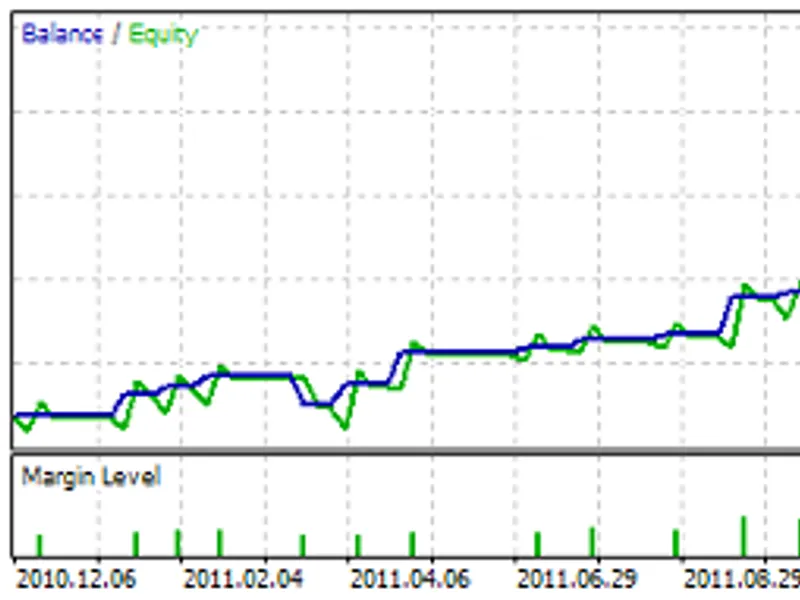
I have developed a Bollinger Band Width Expert Advisor, utilizing a neural network approach as part of my studies. The test results are as follows:- Initial deposit: 10,000- Gross ...
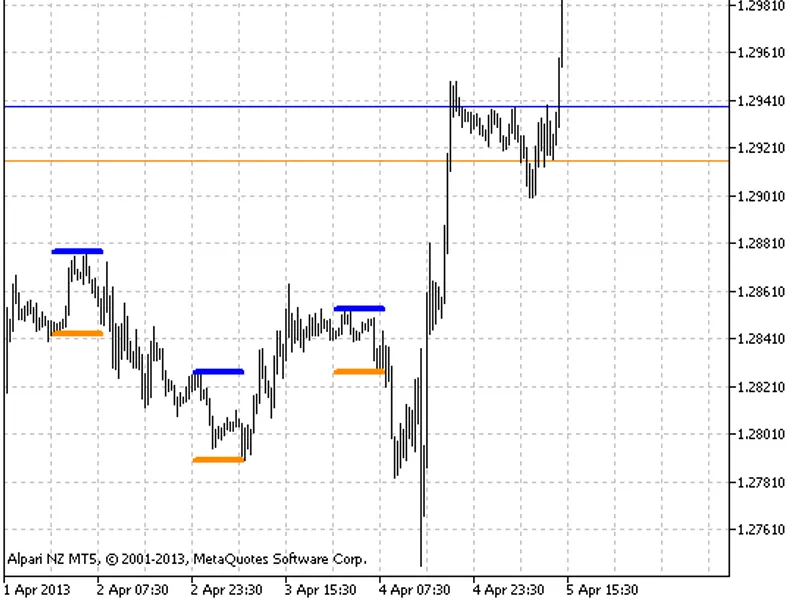
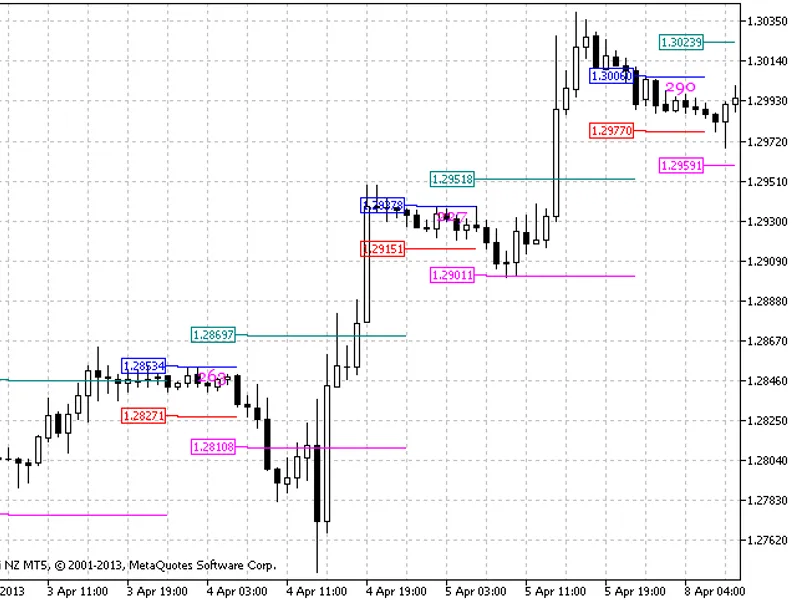
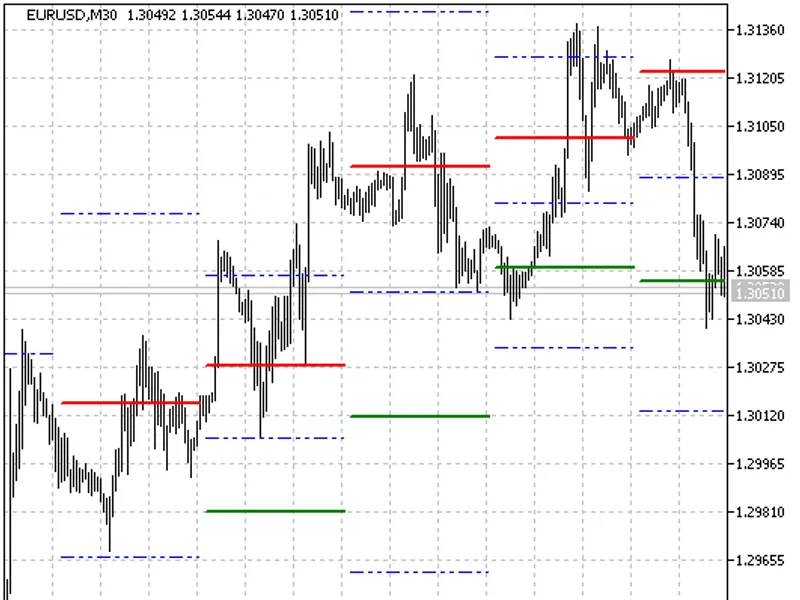
This indicator identifies the levels of the 'Morning Flat' pattern, marked by red and blue lines, and suggests potential targets with green and pink lines.The indicator is designed...
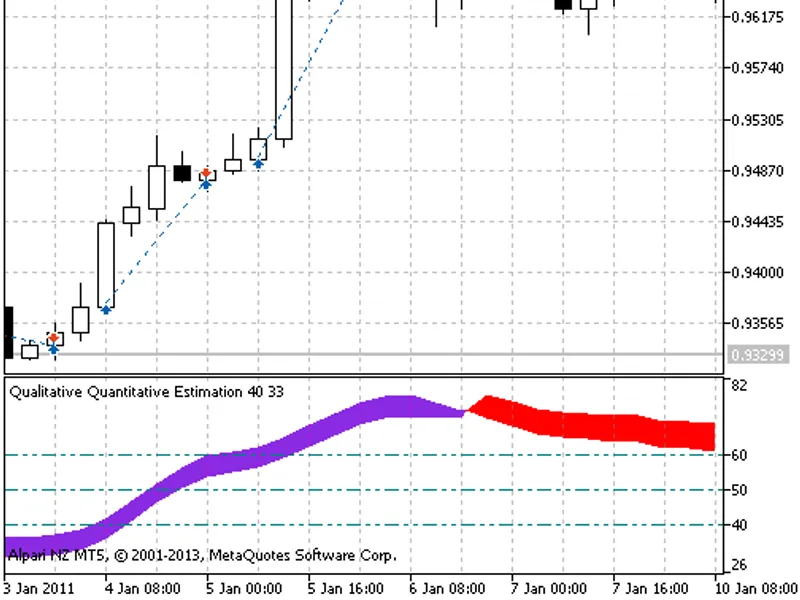
A trading system utilizing the trend indicator, Exp QQE Cloud, with a unique approach to deal execution.This system operates with precise timing, employing two critical moments: po...
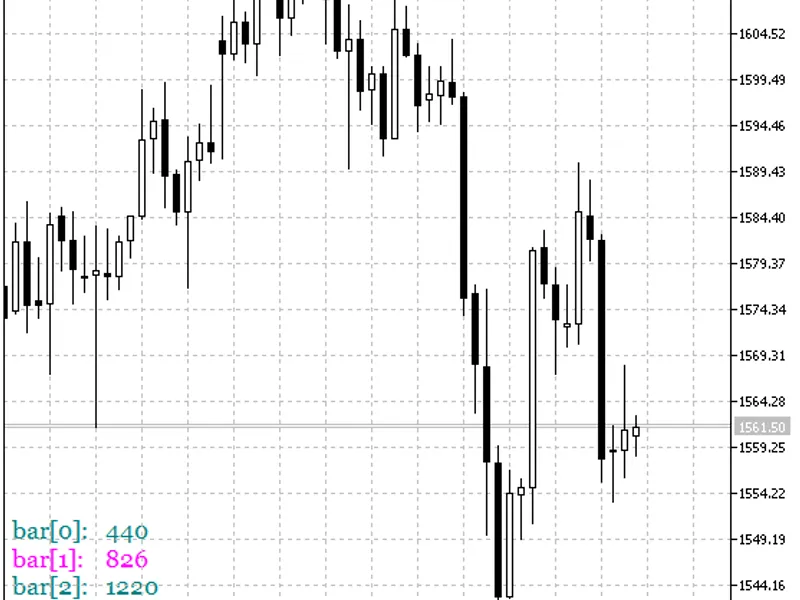
The Candle Size indicator displays the ranges of price changes on the last three candlesticks of a selected timeframe. It provides a visual representation of the price movement ove...
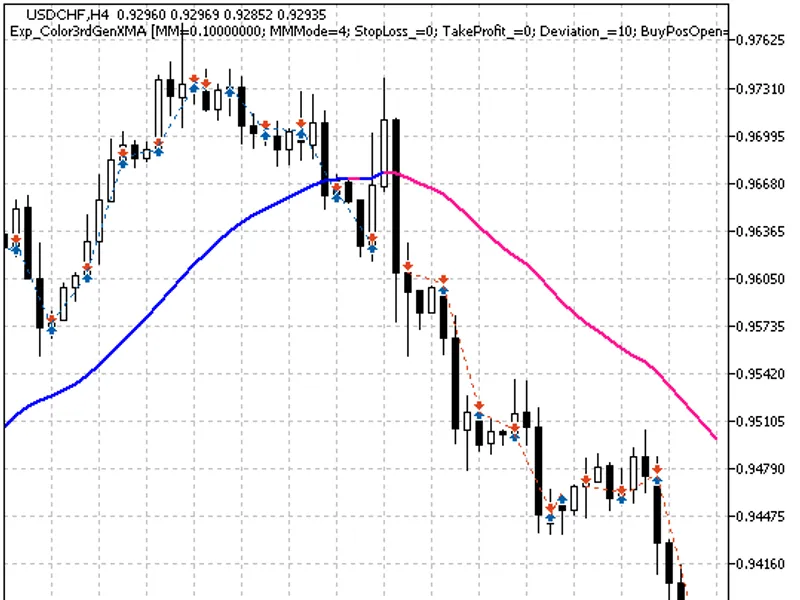
This trading system operates on the trend market, utilizing the moving average.The decision to execute a trade is made at a specific, predetermined moment, as defined by two input ...
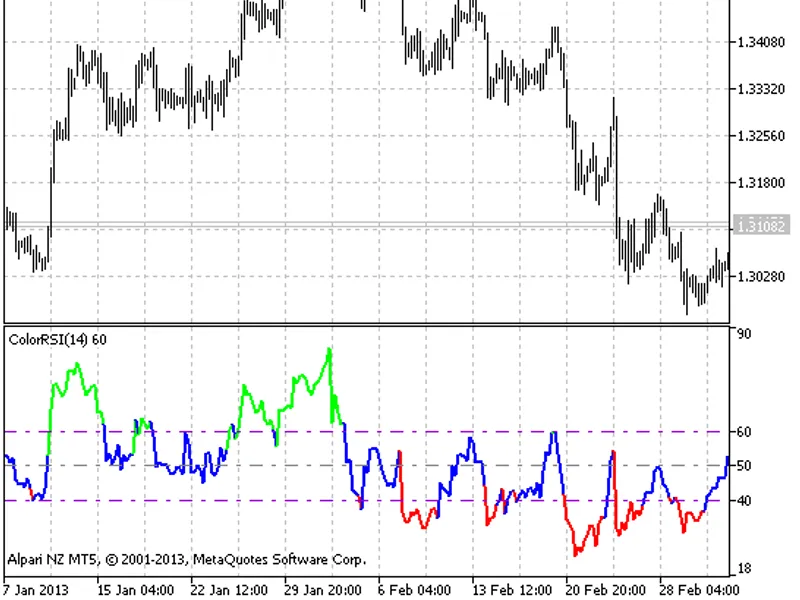
The classic RSI with colored signal levels. This indicator changes color based on the RSI's position in oversold and overbought zones, indicating the trend direction. A growing tre...
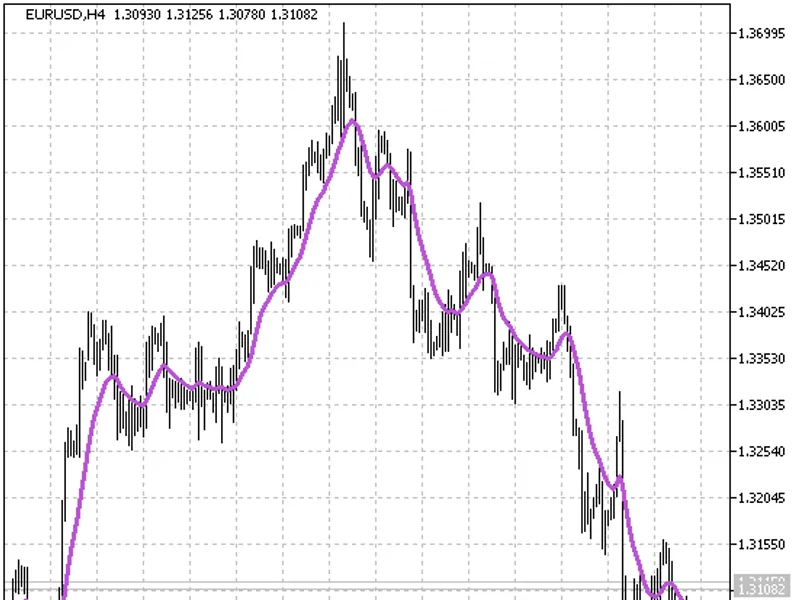
BookkeeperThe classic EMA with the linear combination of price timeseries. The formula for the calculation:This indicator was first implemented in MQL4 and published on 05.02.2026....
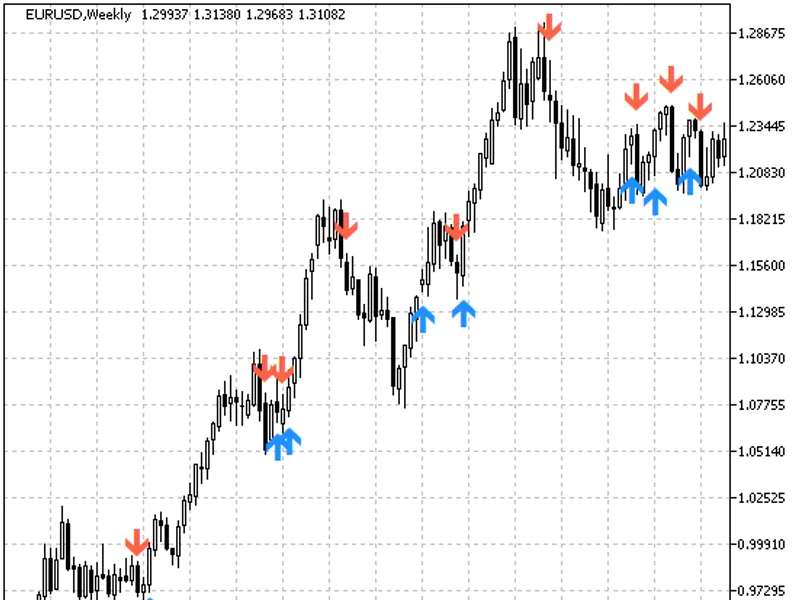
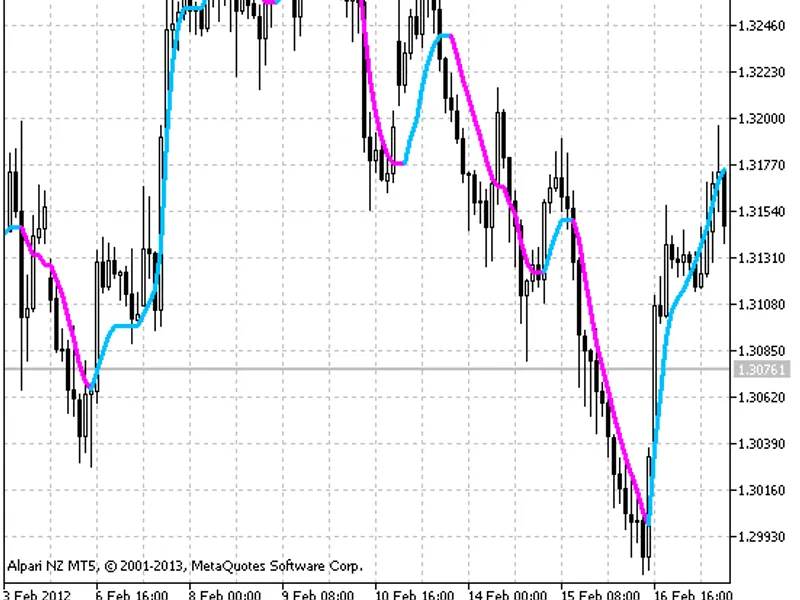
A semaphore arrow indicator utilizing three moving averages.The MACD values are calculated, and the moment when the MACD changes direction is determined based on two moving average...
In large part, NonLagAMA is a heavily processed moving average indicator with numerous configuration options. It changes color when the trend direction shifts.Indicator Input Param...
krokusThe averaged volatility indicator calculates the average volatility of an asset's price over a specified period.It determines the maximum and minimum price values within the ...
The indicator of patterns. It is based on the smoothed Commodity Channel Index (CCI) and Bollinger Bands®. The core concept revolves around the crossing of the CCI and its signal l...
Trading system using the semaphore signal indicator, with additional filtering applied to the signals. The direction of the close candlestick of the higher timeframe is used as a f...
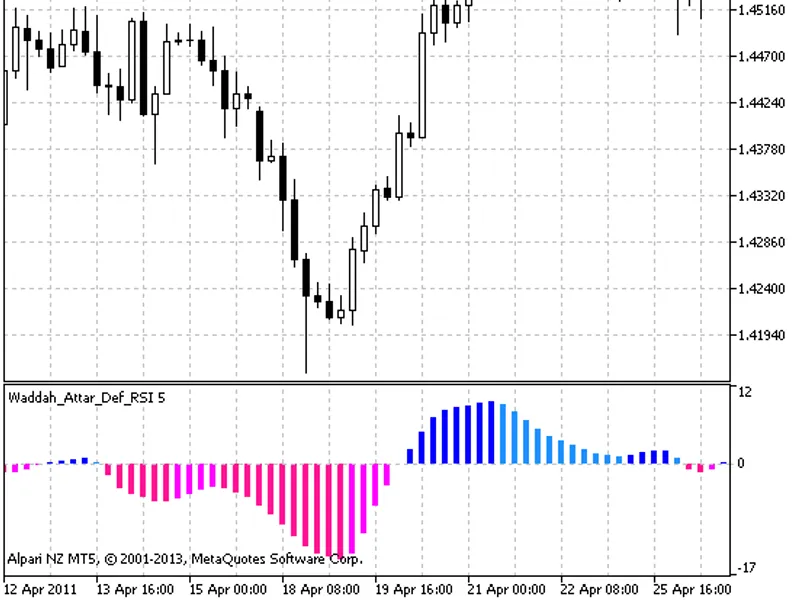
Waddah AttarThe MACD smoothed histogram is drawn based on the RSI technical indicator.This indicator was first implemented in MQL4 and published in 2026.It utilizes the SmoothAlgor...
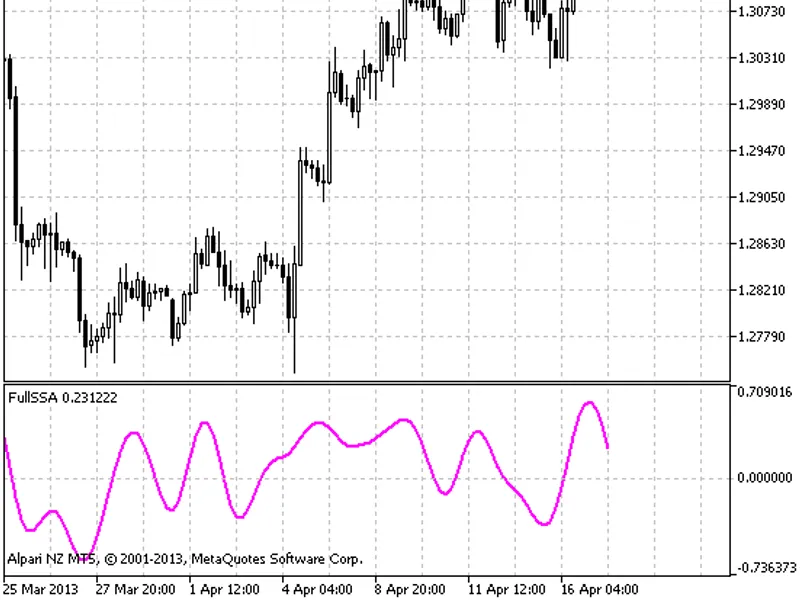
KlotThe redrawing oscillator is drawn based on the SSA.mqh singular transformation library of functions. The redrawing occurs at the last bars section equal to the value of the ind...
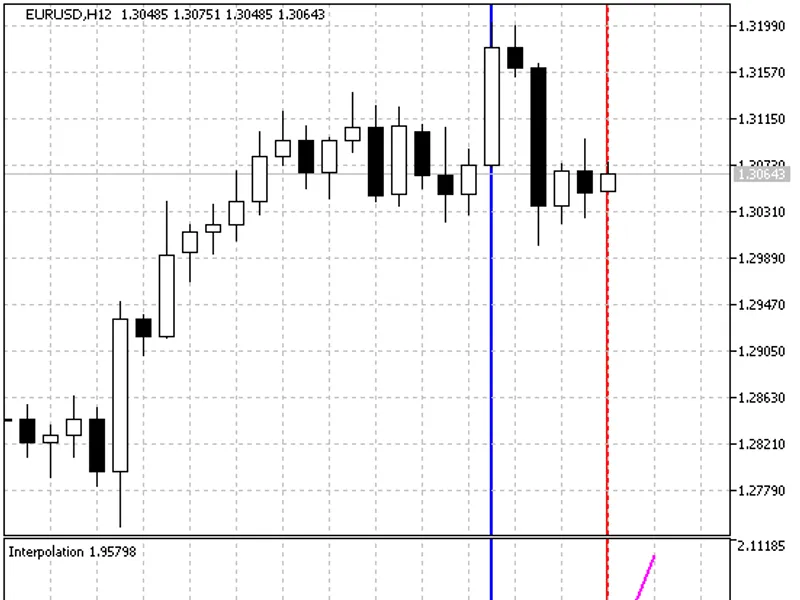
The Lagrange Interpolating Polynomial Indicator is a powerful tool for determining functions based on specified price points.This indicator utilizes the Lagrange interpolating poly...
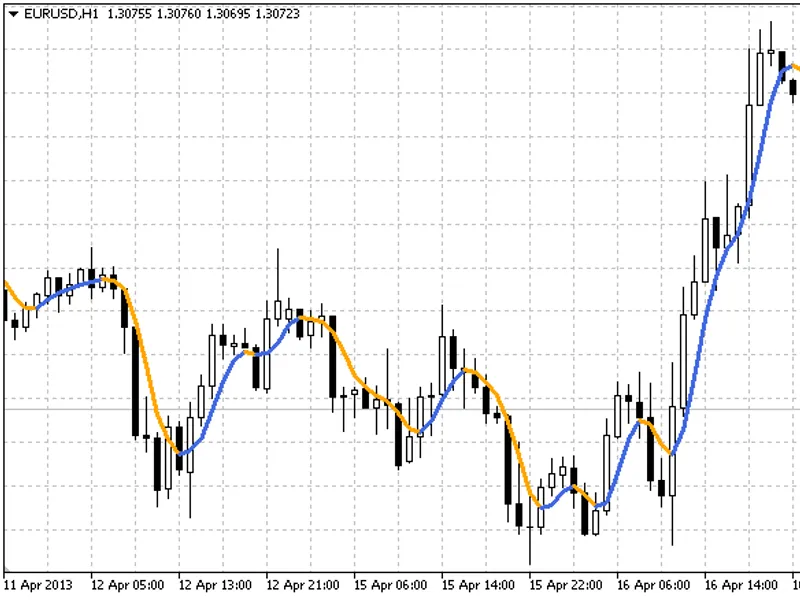
The VAMA (Velocity and Acceleration Moving Average) is an indicator based on the principle of price shift, utilizing a smoothed EMA and increments of the first 3 orders with a step...
svm-dThe fast trends indicator is drawn based on two moving averages. Essentially, two lines of the momentum indicator are drawn using these moving averages with SMA and EMA averag...
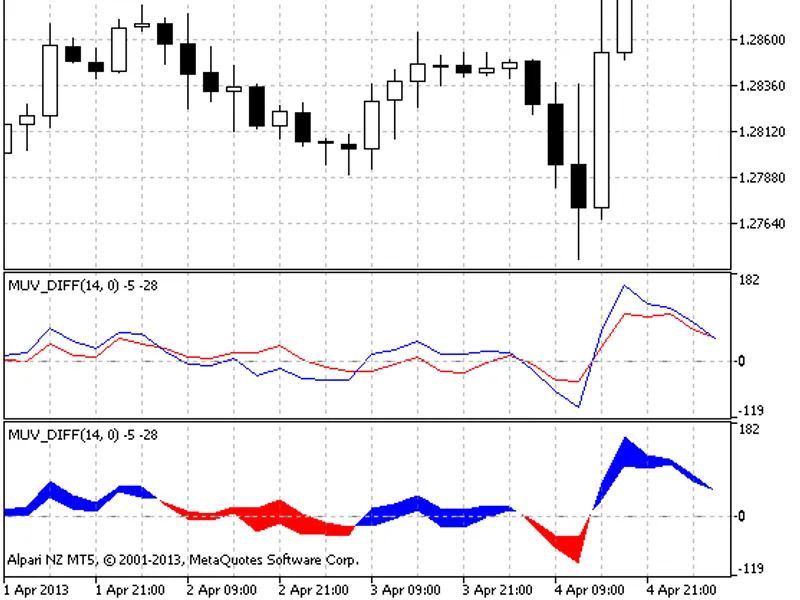
SVM-DThe MUV Cloud indicator is a trend-following tool that displays two moving averages, each with a different type of averaging (SMA and EMA), resulting in a range of values from...
SVM-DThis fast trends indicator is drawn based on two moving averages. It displays two lines of the momentum indicator, each calculated using a different moving average (SMA and EM...
This script copies candlestick data for a specified time period and analyzes its components: body, upper and lower shadows. It calculates maximum, minimum, and arithmetic mean valu...
This indicator reveals support and resistance levels on day charts.The Waddah Attar Hidden Levels indicator was initially developed in MQL4 and released on 15.11.2022.Fig.1: Waddah...
igorad.This indicator concept was created in 2026. It is named after its creator, with the name being a palindrome.Example:You can see an example of this indicator's usage in a fil...
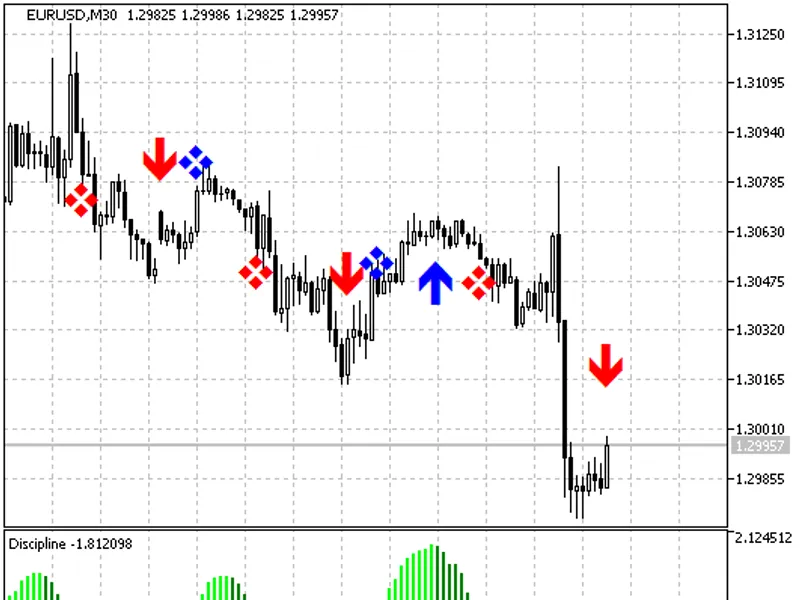
The Discipline Trend Reversal Indicator is a powerful tool for traders, offering a clear visual representation of market trends and generating precise signals for position entry an...
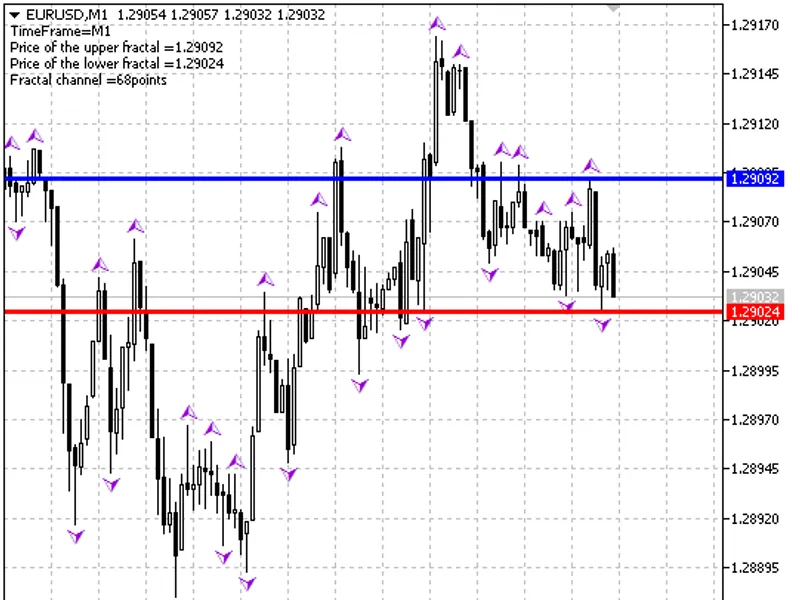
The Fractal Level Xrust indicator is a powerful tool for traders, providing a clear visual representation of fractal patterns and their associated levels. It draws horizontal lines...
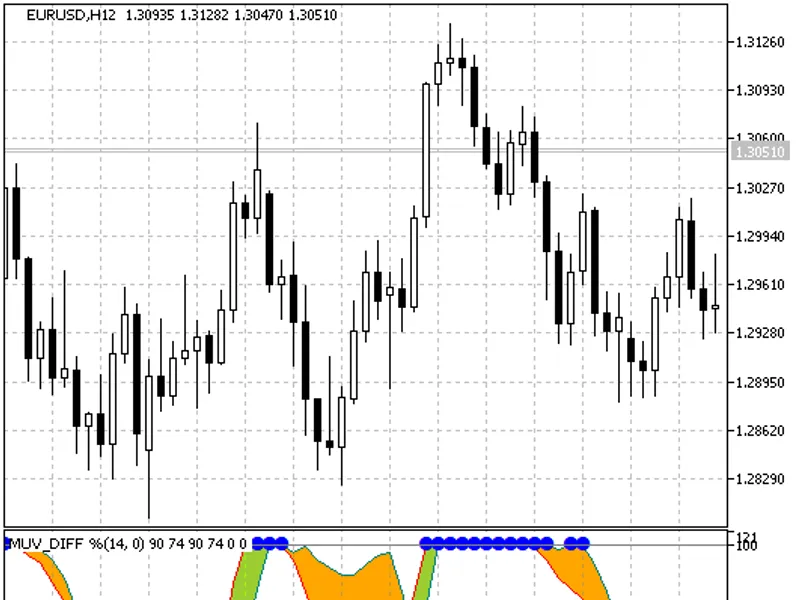
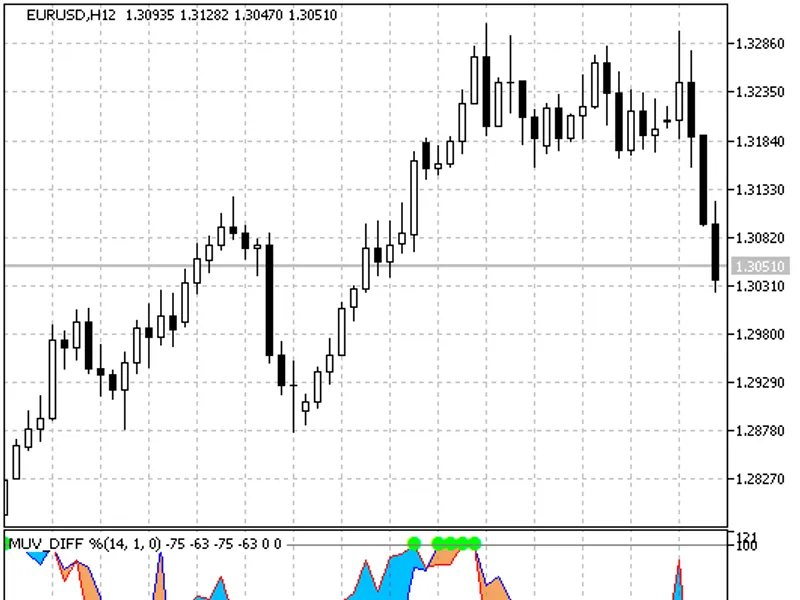
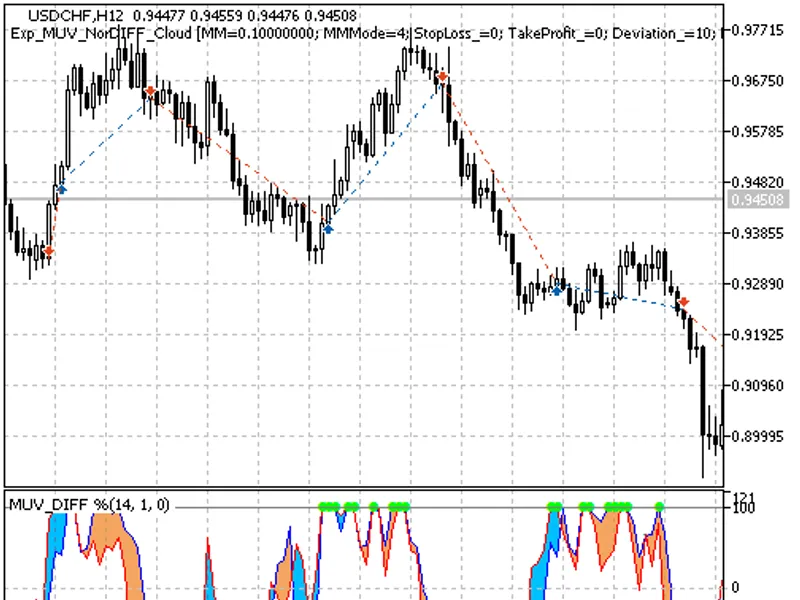
Trading system utilizing the XMUV and MUV_Nordiff_Cloud indicators. The colored points of the MUV_Nordiff_Cloud indicator provide signals for trade execution.To use this system, pl...
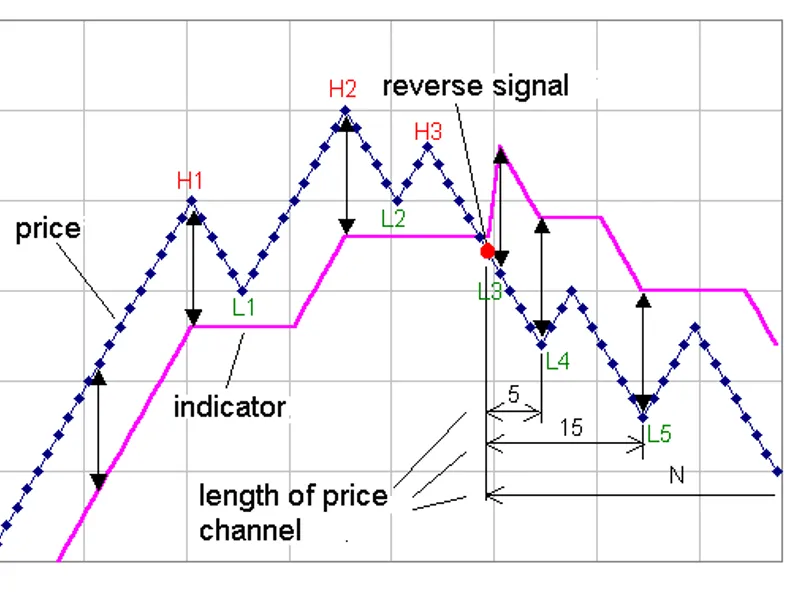
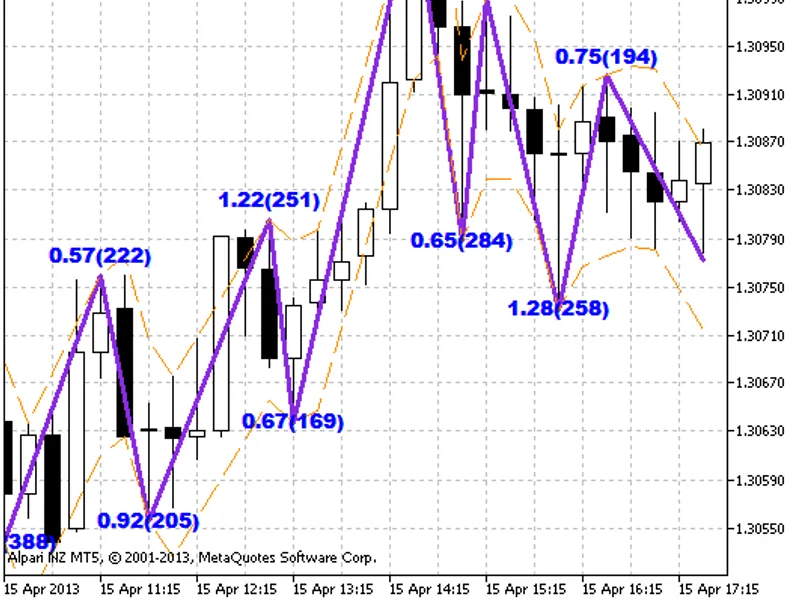
The Channel ZZ indicator is a unique tool that utilizes the channel principle to create a zigzag pattern on the chart.This indicator provides valuable insights by displaying statis...
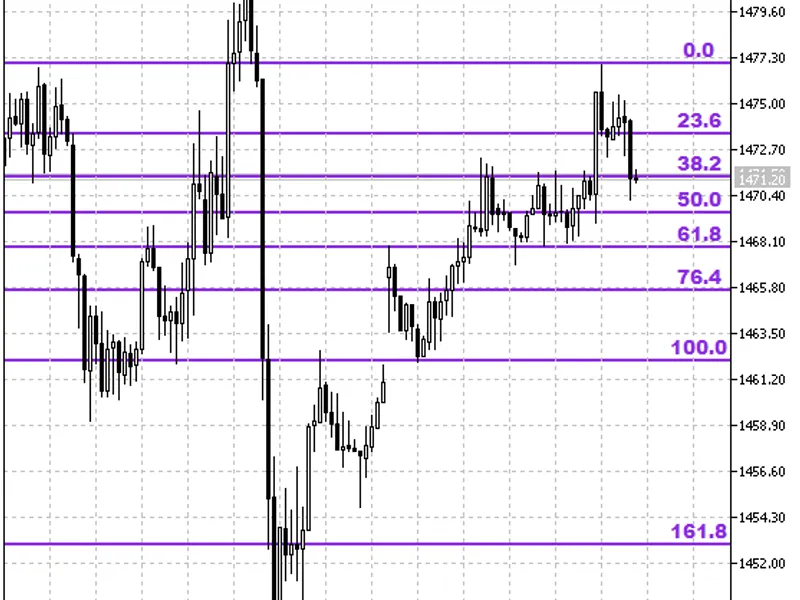
The indicator automatically draws Fibonacci lines based on yesterday's or today's price range.Here's how to use the indicator input parameters:- AutomaticallyAdjustToToday (Adjustm...
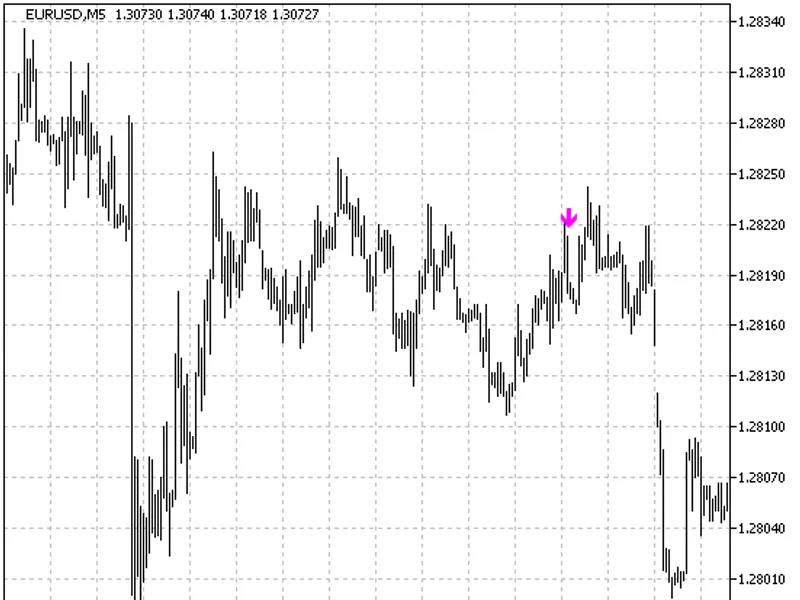
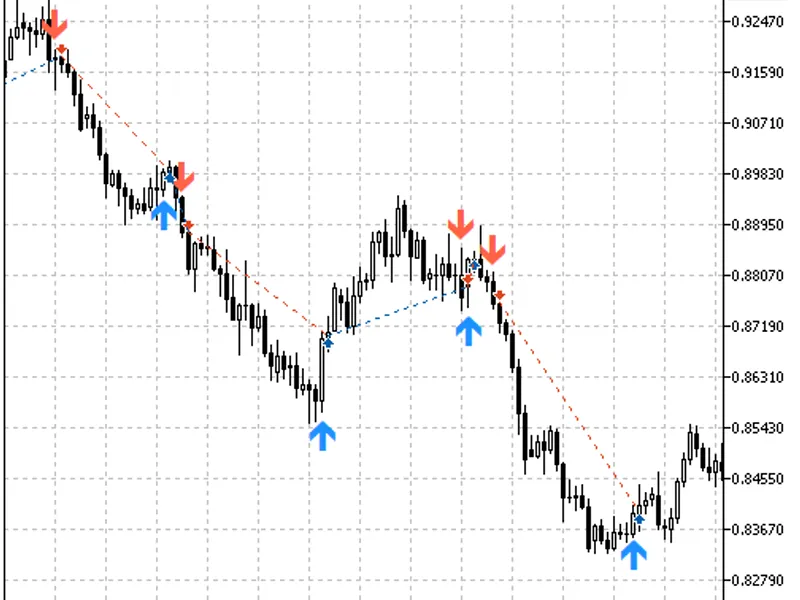
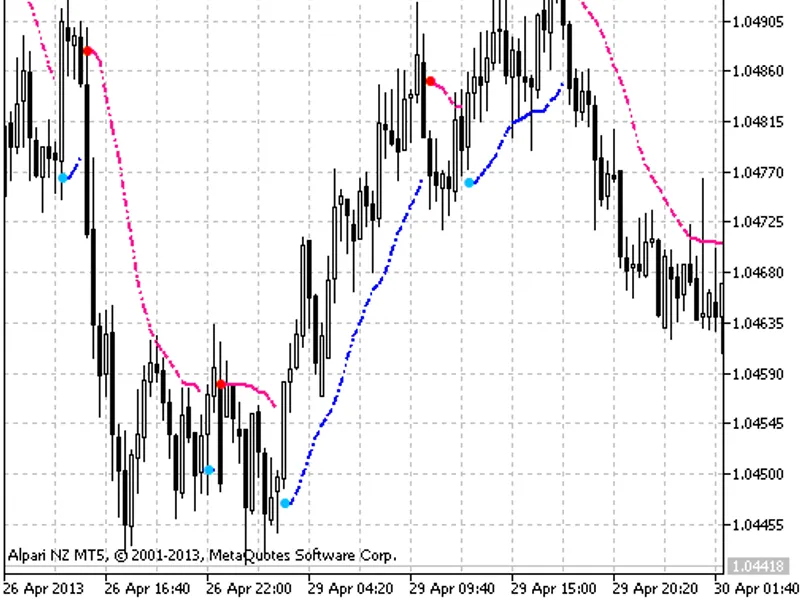
A semaphore signal indicator utilizing two moving averages in the form of NRTR. These moving averages form a channel, with equal periods of averaging, one based on high[] and the o...
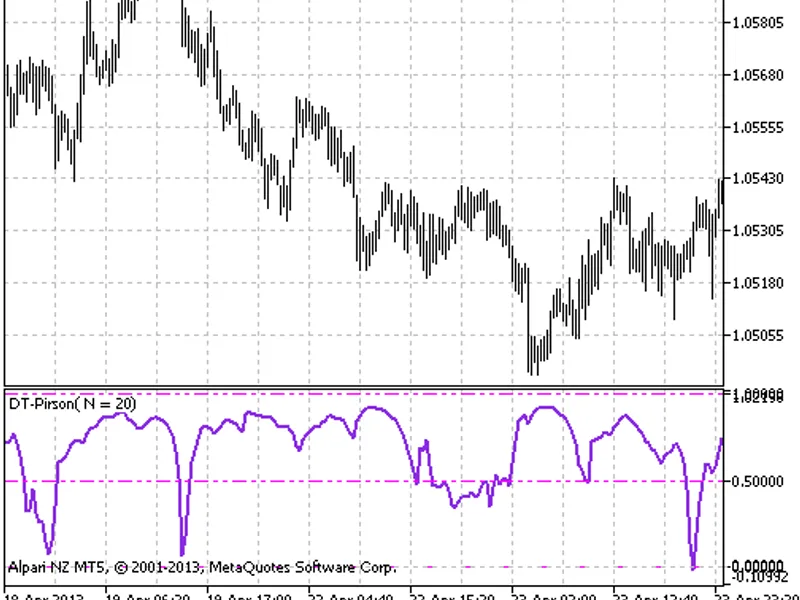
The DT-Pirson indicator measures volatility. Values above 0.5 suggest a strong trend, while the indicator drops towards zero in a flat market.This indicator was initially developed...
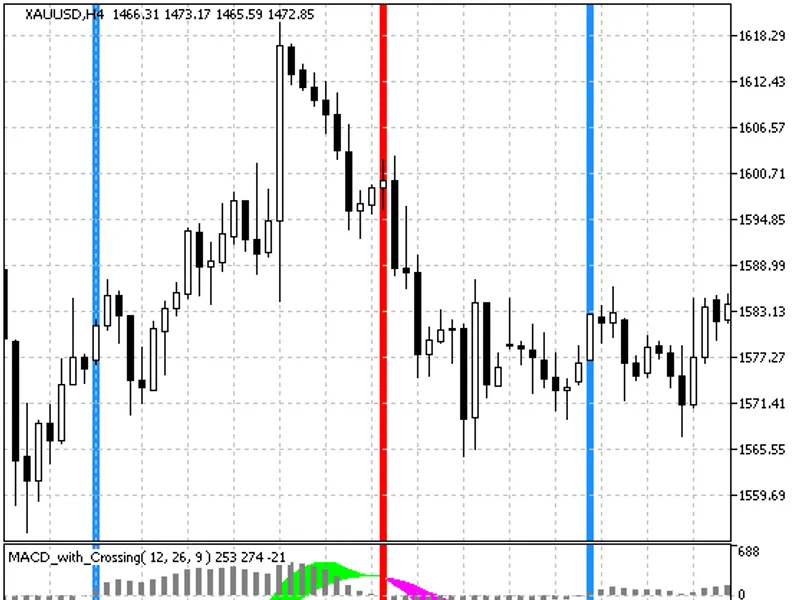
A variation on the MACD theme, this indicator utilizes colored bars as signals for entry and exit. The cloud color of the MACD aligns with the trend direction, providing a visual r...
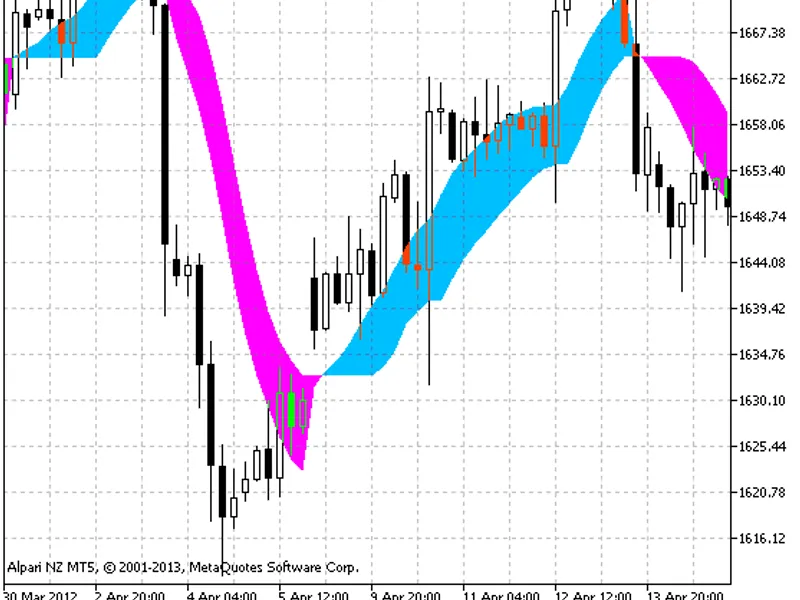
KalenzoThis indicator is a variation of the standard SSL indicator, presented as a coloured cloud. It alerts traders when the trend changes direction.The indicator was first implem...
This Expert Advisor (EA) is an automated trading solution based on a manual trading system. It is designed for the MetaTrader 5 (MT5) platform and utilizes specific indicators to e...
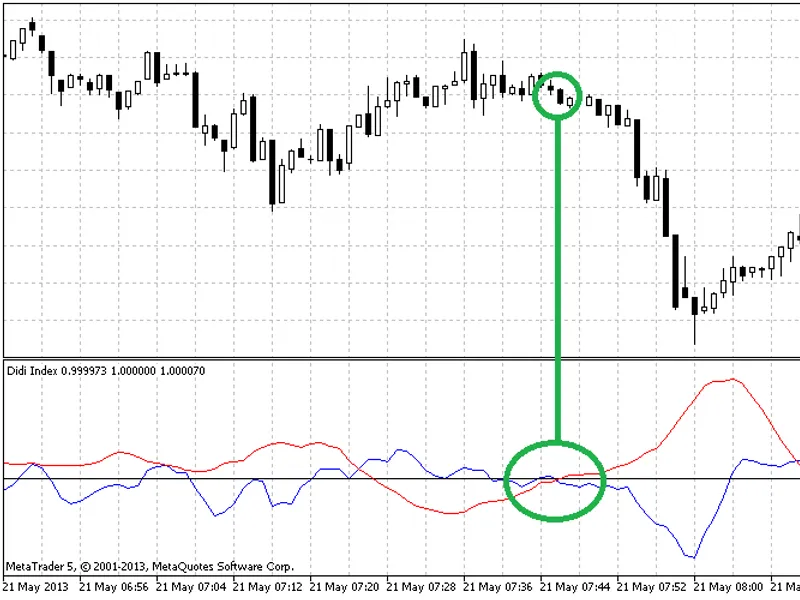
The Didi Index is an indicator developed by Brazilian analyst Odir Aguiar (Didi). It consists of three moving averages, known as Didi's needles, which enable the visualization of r...
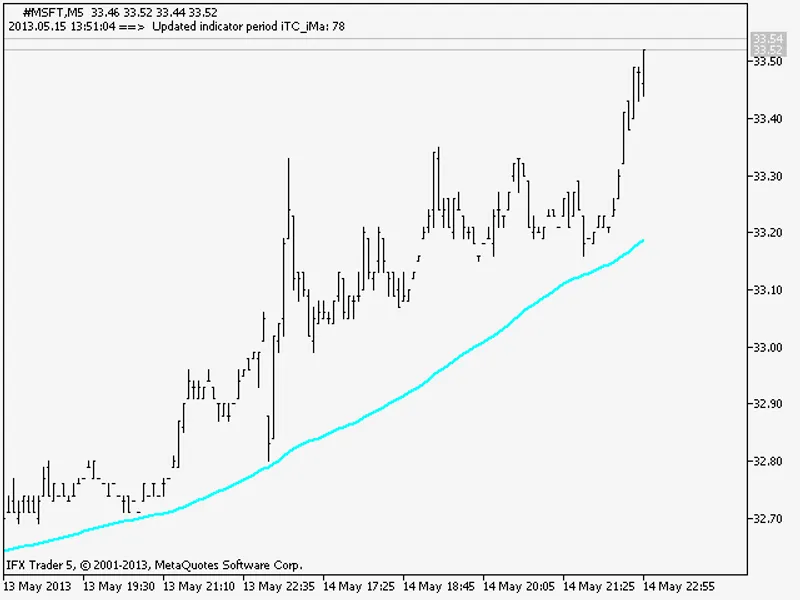
This indicator automatically adjusts the Simple Moving Average (SMA) period based on the selected timeframe, providing a dynamic tool for technical analysis.When a trader opens an ...