Institutional Kinematic Price Physics (Velocity and Acceleration)
This professional-grade solution for MetaTrader 5 helps traders achieve greater efficiency in their daily workflow. This technical indicator acts as a specialized analysis tool designed to visualize market data. It helps traders identify emerging trends, momentum shifts, and key support or resistance levels by plotting statistical calculations directly onto price charts.
How to Setup and Use Institutional Kinematic Price Physics (Velocity and Acceleration)
1. Installation: Place your file in the MQL/Indicators folder via "Open Data Folder" and restart your terminal.
2. Loading: Find the indicator in the Navigator, drag it onto your chart, and configure the input parameters in the popup window.
3. Customization: Press Ctrl+I to open the indicator list, select your tool, and click "Properties" to change colors, levels, or visual styles.
4. Updating: Replace the old file in the Indicators folder with the new version and restart the platform to apply changes.
Frequently Asked Questions
Q: Why is my indicator not showing? A: Verify the file is in the MQL/Indicators folder, or try right-clicking the "Indicators" tree in the Navigator and clicking "Refresh."
Q: Do custom indicators slow down the platform? A: Too many complex indicators can impact performance; remove unused ones via the "Indicator List" (Ctrl+I).
Q: Can I use MT4 indicators on MT5? A: No, MQL4 and MQL5 are distinct languages; ensure the indicator is compiled specifically for your platform version.
Description & Settings
The Mathematical Delay of Retail Momentum
Standard momentum indicators (like the MACD or RSI) are mathematically doomed to fail because they are built on moving averages. By definition, an average requires historical data to process a signal, resulting in a permanent phase-lag. When a retail momentum indicator finally signals a trend reversal, the institutional algorithms have already liquidated their positions and trapped retail liquidity.
The Institutional Edge: Kinematic Physics
Proprietary trading firms do not measure momentum with averages; they measure it with
Differential Calculus
.
The
Institutional Kinematic Physics Engine
maps financial time-series exactly like a moving object in classical physics. It calculates the First Derivative to extract raw
Velocity
and the Second Derivative to extract raw
Acceleration
.
The Law of Market Exhaustion
Think of a speeding car approaching a red light. Before the car can reverse direction (Price Reversal), it must first step on the brakes (Negative Acceleration), even while the car is still moving forward (Positive Velocity).
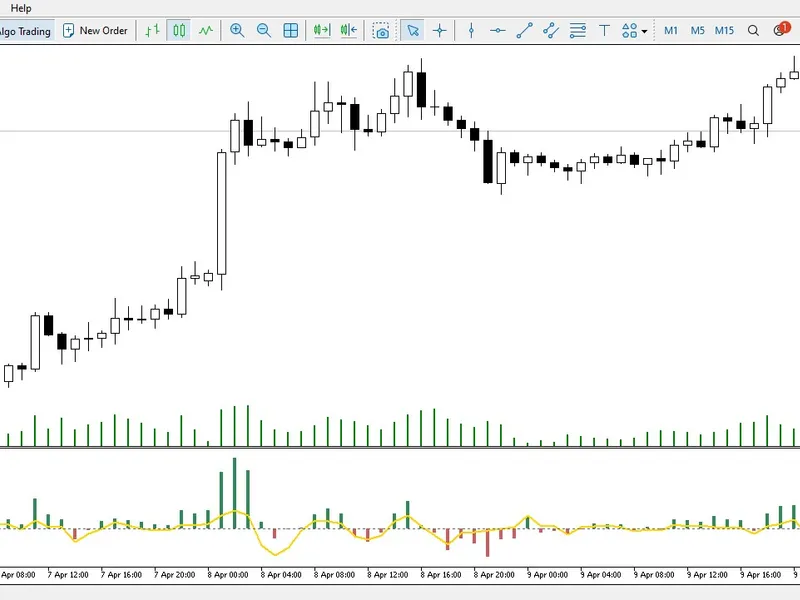
Velocity (Histogram):
Shows the current raw speed and direction of the price execution.
Acceleration (Line):
Shows the rate at which velocity is changing.
This is the ultimate leading indicator.
When Acceleration drops below the zero-line while Velocity is still high, it mathematically proves the trend is exhausted and institutional buying pressure has vanished.
Core Quantitative Architecture
Mathematical Derivatives:
Computes $V = dP/dt$ and $A = dV/dt$ using a discrete time-step algorithm.
Zero-Lag Calculation:
Completely bypasses the smoothing lag of standard oscillators, reacting to structural shifts in milliseconds.
Algorithmic Filter Overlay:
Use the Acceleration line as your primary structural warning. Never let your Expert Advisor buy a breakout if the Kinematic Acceleration is already decaying.