Institutional Stat Arb and Cointegration Spread Z-Score
This professional-grade solution for MetaTrader 5 helps traders achieve greater efficiency in their daily workflow. This technical indicator acts as a specialized analysis tool designed to visualize market data. It helps traders identify emerging trends, momentum shifts, and key support or resistance levels by plotting statistical calculations directly onto price charts.
How to Setup and Use Institutional Stat Arb and Cointegration Spread Z-Score
1. Installation: Place your file in the MQL/Indicators folder via "Open Data Folder" and restart your terminal.
2. Loading: Find the indicator in the Navigator, drag it onto your chart, and configure the input parameters in the popup window.
3. Customization: Press Ctrl+I to open the indicator list, select your tool, and click "Properties" to change colors, levels, or visual styles.
4. Updating: Replace the old file in the Indicators folder with the new version and restart the platform to apply changes.
Frequently Asked Questions
Q: Why is my indicator not showing? A: Verify the file is in the MQL/Indicators folder, or try right-clicking the "Indicators" tree in the Navigator and clicking "Refresh."
Q: Do custom indicators slow down the platform? A: Too many complex indicators can impact performance; remove unused ones via the "Indicator List" (Ctrl+I).
Q: Can I use MT4 indicators on MT5? A: No, MQL4 and MQL5 are distinct languages; ensure the indicator is compiled specifically for your platform version.
Description & Settings
The Flaw in Directional Trading & Simple Correlation
Most retail algorithms attempt to predict directional market moves, exposing capital to unpredictable macroeconomic shocks. To mitigate this, some traders use simple "Correlation" across pairs (e.g., EURUSD vs GBPUSD). However, correlation is a flawed metric for trading because two assets can be highly correlated while their spread diverges indefinitely.
The Institutional Edge: Cointegration & StatArb
Top-tier quantitative hedge funds operate
Market Neutral
portfolios through Statistical Arbitrage (StatArb). Instead of predicting direction, they rely on
Cointegration
—a mathematical property ensuring that the spread between two historically linked assets will eventually revert to its mean.
The
Institutional StatArb Spread Z-Score
brings this advanced portfolio mathematics directly to your MQL5 terminal.
Core Quantitative Architecture
Logarithmic Spread Calculation:
The engine does not simply subtract prices. It calculates the natural logarithm differential ( Log(Asset A) - Log(Asset B) ) to normalize volatility across instruments with different pricing scales (e.g., Gold vs. Silver).
Dynamic Spread Z-Score:
It applies a rolling standard deviation (Z-Score) to the spread. This unbound metric reveals exactly how many standard deviations the current spread has strayed from its historical baseline.
Multi-Asset Time Synchronization:
Native MQL5 handling perfectly synchronizes the time-series data between the chart symbol and the secondary injected symbol, ensuring accurate tick-by-tick spread calculation even if one asset has missing broker data.
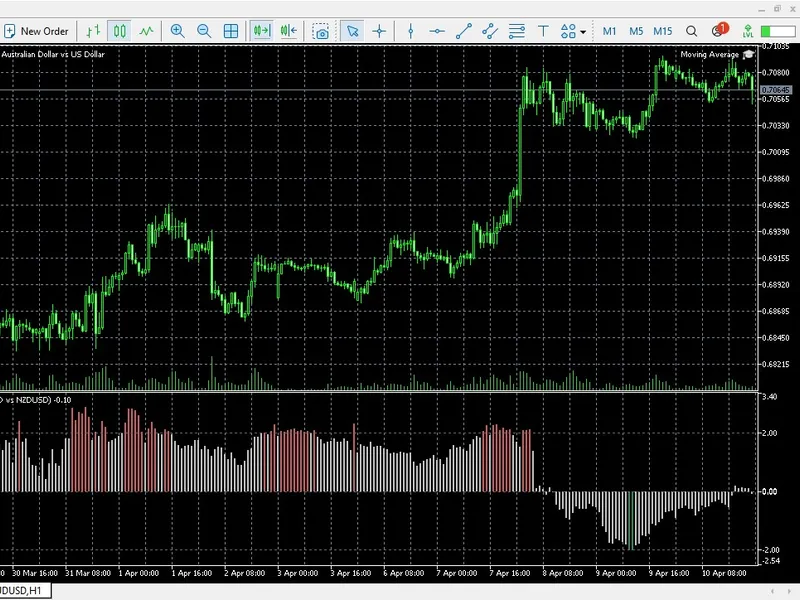
How to Execute a Pairs Trade (Market Neutral)
Attach the Indicator:
Place it on an asset (e.g., AUDUSD ) and input the naturally cointegrated pair in the settings (e.g., NZDUSD ).
Identify Divergence:
Wait for the Spread Z-Score to breach the critical extremes (e.g., +2.5 or -2.5 ).
Execute the Arbitrage:
If Z-Score hits
+2.5
(Spread is too wide): Sell Asset A and Buy Asset B.
If Z-Score hits
-2.5
(Spread is too narrow): Buy Asset A and Sell Asset B.
Close both legs simultaneously when the Z-Score returns to 0.0 (The Mean).