Day Trader Market Profile
This professional-grade solution for MetaTrader 4 helps traders achieve greater efficiency in their daily workflow. This technical indicator acts as a specialized analysis tool designed to visualize market data. It helps traders identify emerging trends, momentum shifts, and key support or resistance levels by plotting statistical calculations directly onto price charts.
How to Setup and Use Day Trader Market Profile
1. Installation: Place your file in the MQL/Indicators folder via "Open Data Folder" and restart your terminal.
2. Loading: Find the indicator in the Navigator, drag it onto your chart, and configure the input parameters in the popup window.
3. Customization: Press Ctrl+I to open the indicator list, select your tool, and click "Properties" to change colors, levels, or visual styles.
4. Updating: Replace the old file in the Indicators folder with the new version and restart the platform to apply changes.
Frequently Asked Questions
Q: Why is my indicator not showing? A: Verify the file is in the MQL/Indicators folder, or try right-clicking the "Indicators" tree in the Navigator and clicking "Refresh."
Q: Do custom indicators slow down the platform? A: Too many complex indicators can impact performance; remove unused ones via the "Indicator List" (Ctrl+I).
Q: Can I use MT4 indicators on MT5? A: No, MQL4 and MQL5 are distinct languages; ensure the indicator is compiled specifically for your platform version.
Description & Settings
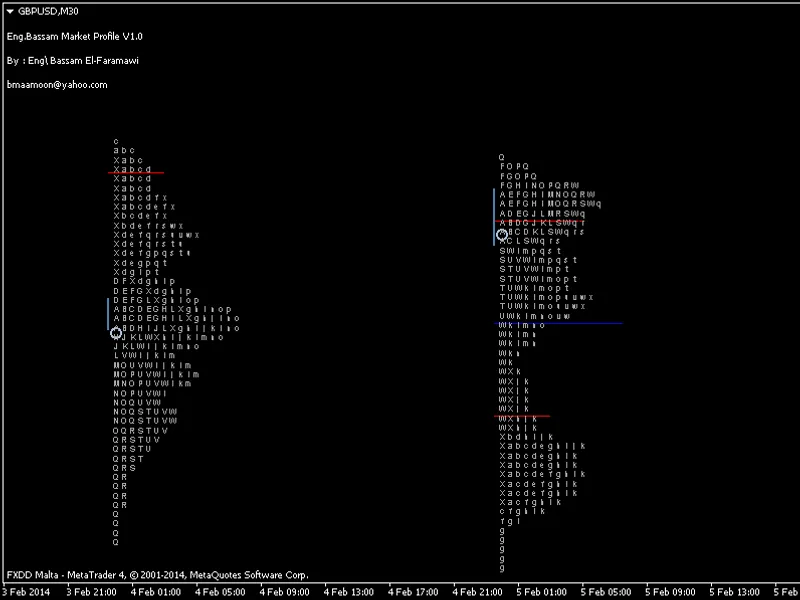
Bassam Faramawi.
The indicator Simulates the full structure of the market profile system that described by "James Dalton" in his book "Mind Over Markets" for the market profile day trader including TPOs, POC, RL, VA and IB. It brings full system to the screen of MT4, as it in the Market profile service providers with the typical interface. It draw the TPOs as letters or blocks the way you want, detects the TPO value area(not the volume VA) of the percentage you detect (0.7 is the default) and shows the Point of control of the day and the Initial Balance plus the opening flag for all of a number of days. It allows to shift this parameters to next day (or number of days) to help you building the accurate vision of the current formative day. the ability to view the profile of the American, the Euro, the Asian sessions or the hole day session. it has also a pointer to detect the active TPO now.
Input parameters:
Step : The step of point between each TPOs.
NumberOfDays : Counts the current and last days you want to view their profiles.
SessionHalfHours : Number of the half-hours in one session (default = 48 means the hole day).
ViewTPOs : To view it or not.
TPOs_as_Letters : If true view as letters ( if false view as blocks).
ViewOpenFlag : View the open of the session.
View_Pointer : View the pointer that point to the active TPo.
ViewrangeLine : View range line of the day or session.
rangeLine_Shift : The shift to next days or sessions.
ViewInitialBalanceLine : View the initial Balance of the session
ViewValueArea : View the TPo Value Area by two limit lines
ValueArea_Shift : The shift to next days or sessions
ViewPocLine : View the Point Of Control of the day or session
PocLine_shift : The shift to next days or sessions
ViewInformationText : Print the range, TPO Value Area and the Tick Volume of the session.
For who asks about what the Market Profile do, see the strategy tester image (1000% Profit).