Applying the Equity graph on the chart
This is a powerful addition to your MetaTrader 4 toolkit designed to optimize market analysis and performance. This technical indicator acts as a specialized analysis tool designed to visualize market data. It helps traders identify emerging trends, momentum shifts, and key support or resistance levels by plotting statistical calculations directly onto price charts.
How to Setup and Use Applying the Equity graph on the chart
1. Installation: Place your file in the MQL/Indicators folder via "Open Data Folder" and restart your terminal.
2. Loading: Find the indicator in the Navigator, drag it onto your chart, and configure the input parameters in the popup window.
3. Customization: Press Ctrl+I to open the indicator list, select your tool, and click "Properties" to change colors, levels, or visual styles.
4. Updating: Replace the old file in the Indicators folder with the new version and restart the platform to apply changes.
Frequently Asked Questions
Q: Why is my indicator not showing? A: Verify the file is in the MQL/Indicators folder, or try right-clicking the "Indicators" tree in the Navigator and clicking "Refresh."
Q: Do custom indicators slow down the platform? A: Too many complex indicators can impact performance; remove unused ones via the "Indicator List" (Ctrl+I).
Q: Can I use MT4 indicators on MT5? A: No, MQL4 and MQL5 are distinct languages; ensure the indicator is compiled specifically for your platform version.
Description & Settings
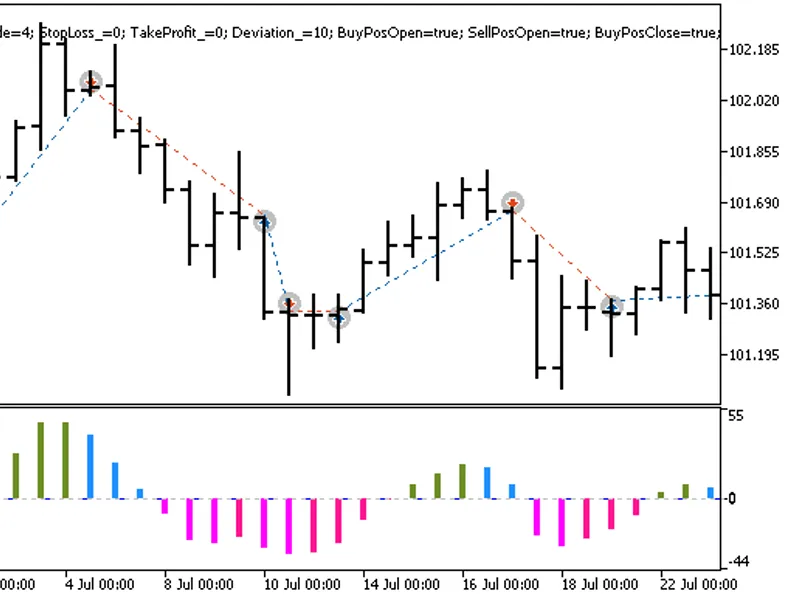
Suppose that there is some data, which is used as the basis for plotting a diagram, for example, a chart of five equities.The source data is stored in the equity.csv file.And this data needs to be viewed on the price chart of some currency pair. And not in a separate window, but right in the window that displays the instrument price. This indicator example is written for such a case. It displays 5 charts of the average equity for five groups with different values of Money Compounding. First, compile the indicator and attach it to the daily chart (the equity.csv file must be placed to experts\files\..). Nothing appears on the chart, this is normal, as the scale of the chart and the scale of the values read from the file have great differences.After that, comment out one line in the indicator code, and, conversely, uncomment the other one, then press F5 (compile). Now there is a normal picture.Thus, the terminal was "deceived" and forced to scale the indicator according to the current price range. This trick is only possible in case the indicator is told to be drawn in a separate window. Receive this picture.
You May Also Like
RobotFX does not own any of the code provided on this platform. All tools are freely available on the internet; we simply index and re-offer them for download. We are not responsible for any financial losses that may occur. Trading responsibilities rely solely on the traders downloading and using the displayed Expert Advisors, indicators, and scripts. These tools are provided for educational purposes only and may require modification or optimization to align with a trader's specific strategy or needs.
© ROBOTFX - Best MetaTrader Expert Advisors & Indicators