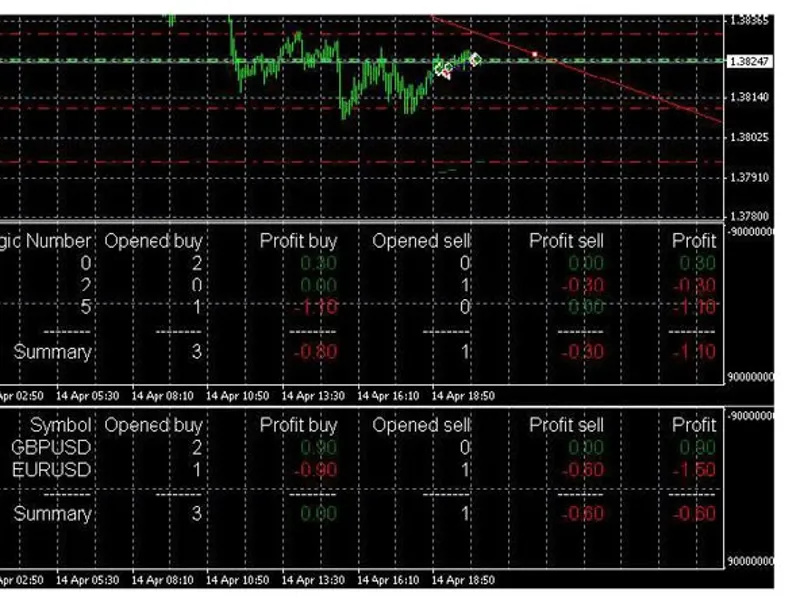
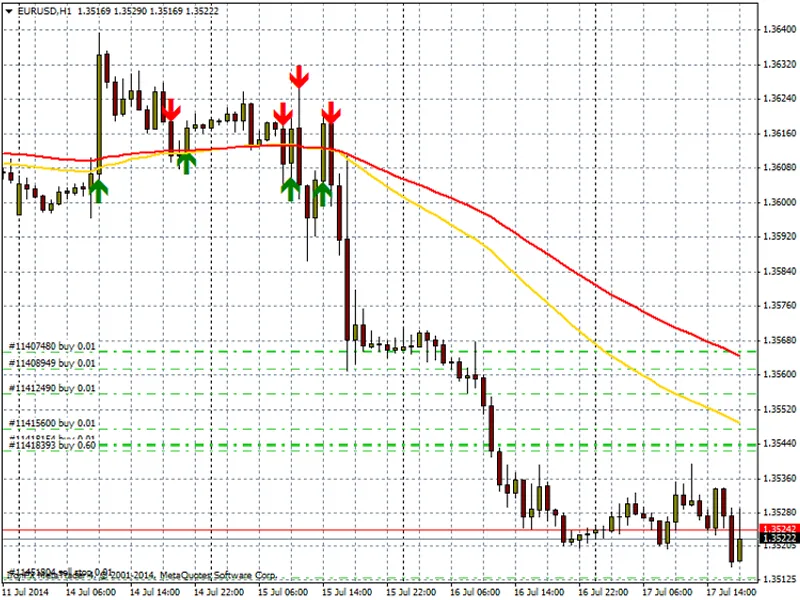
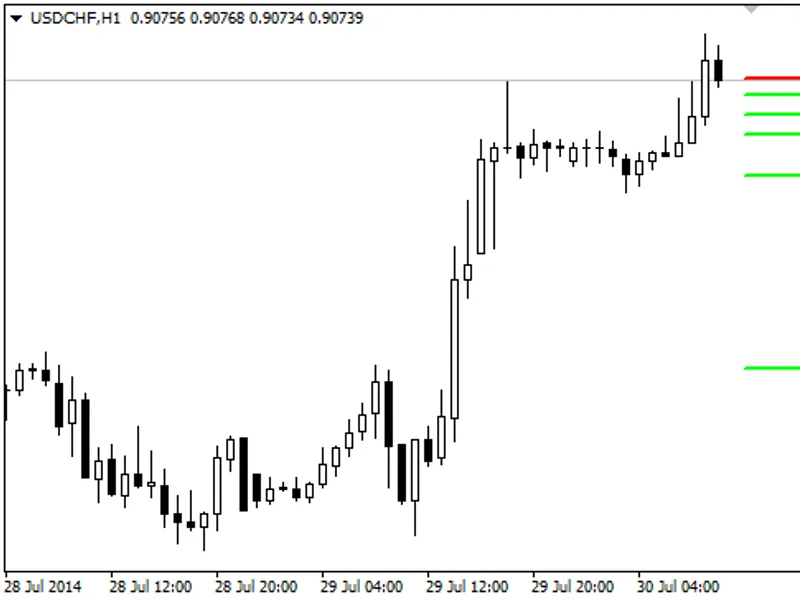
ProfitInfo is an indicator that displays opened buy and sell trades for defined symbols and systems within a single window.This tool consolidates trade information, providing a cle...
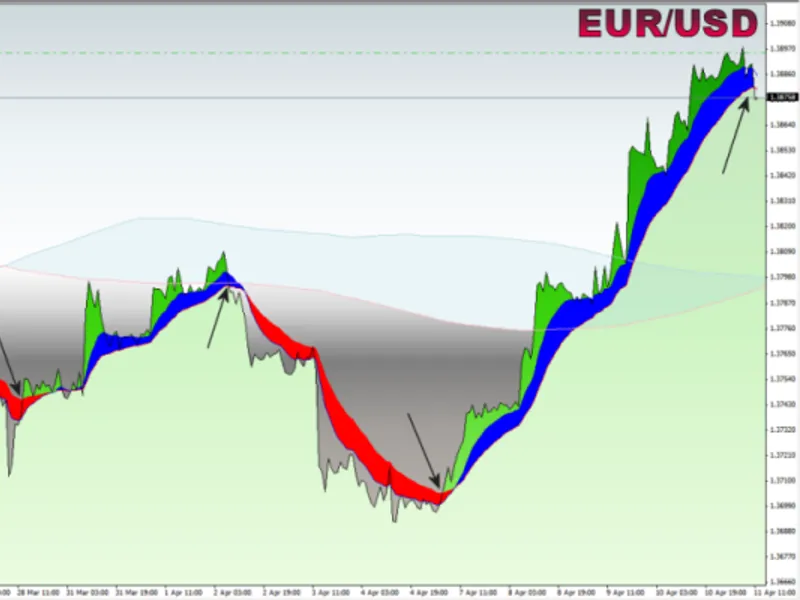
3D MAC Ribbon IndicatorThis indicator draws a 3-dimensional MAC ribbon on the chart. It clearly shows potential entry and exit signals when price moves above or below user-defined ...
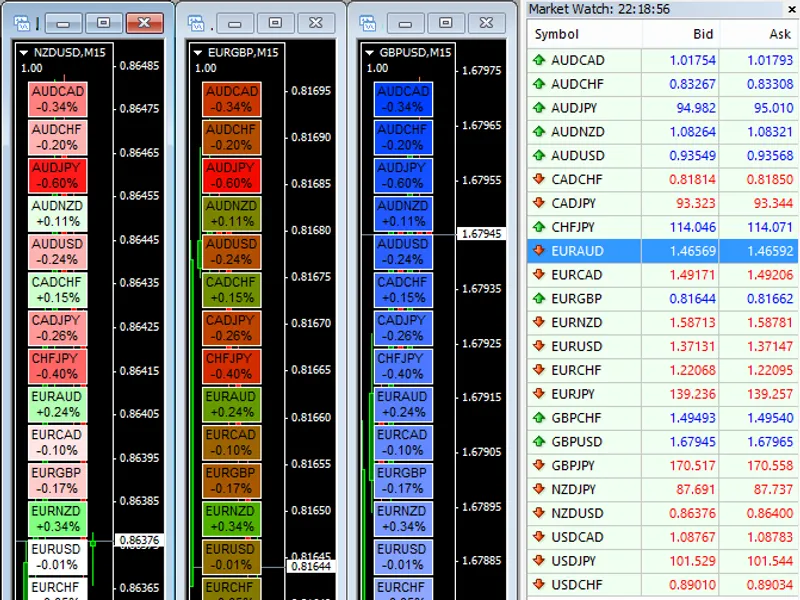
This code demonstrates the creation of color scales, gradients, and heatmaps using MQL4 functions.It utilizes the RGB color model and the standard StringToColor function for color ...
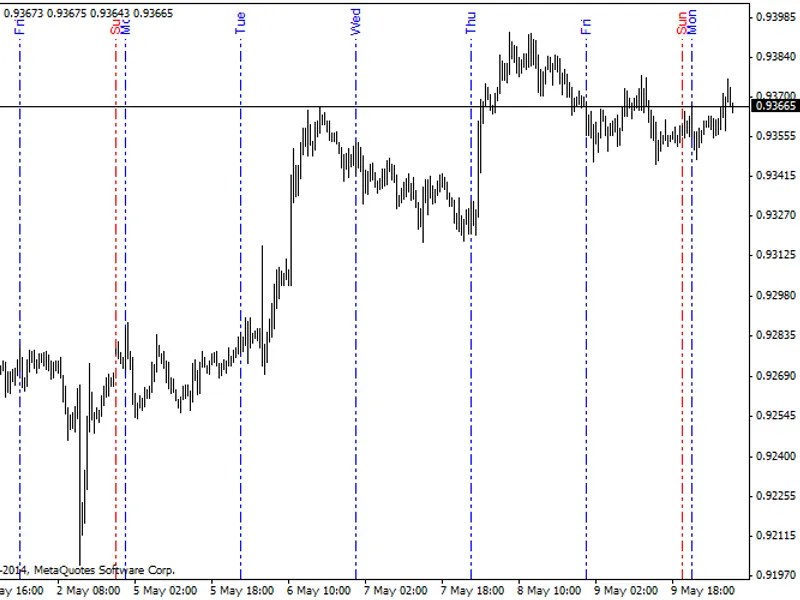
This indicator draws vertical lines on your chart to visually separate each new trading day. The lines appear at the start of each day, acting as clear period separators.Above each...
The Step Up Down Forex Indicator visually represents price direction on your trading chart using single up or down arrows.Recent updates enhance the functionality of the Step Up Do...
XIG XAG is a modification of the ZigZag indicator. It is used within XTrader, which is available on the Market Place.Input Parameters:extDepth: 12; Specifies the number of bars for...
This indicator plots Stopd price levels based on a user-specified timeframe (D - Daily, W - Weekly, M - Monthly, Q - Quarterly, Y - Yearly).Additional parameters allow for customiz...
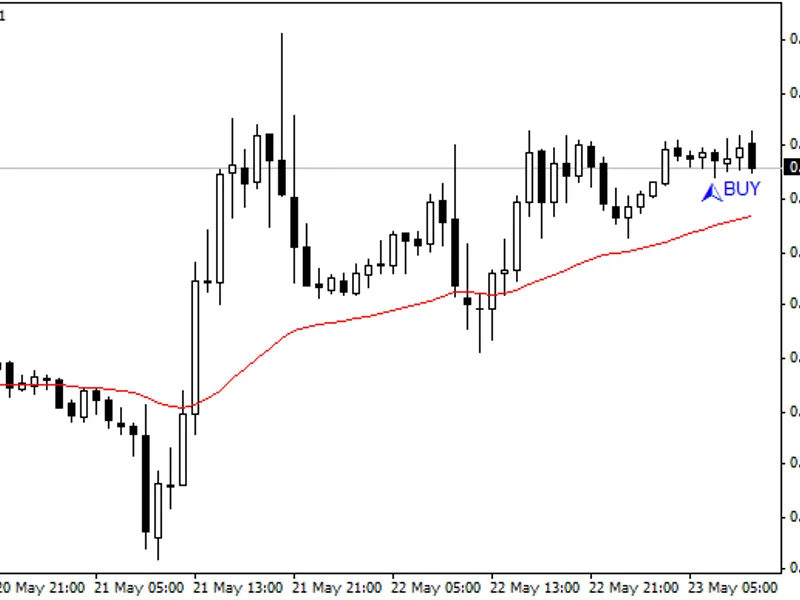
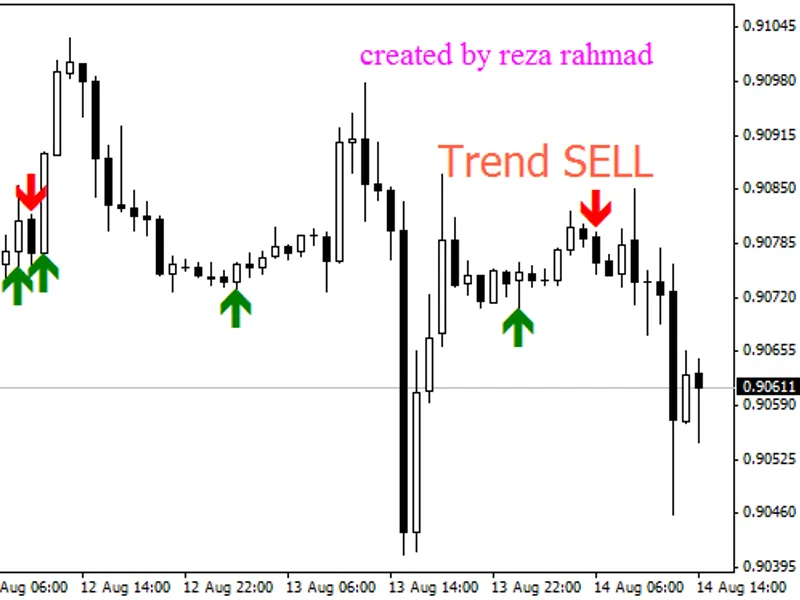
The indicator displays entry points.The system is described in the accompanying documentation.This is a tool for traders to identify potential trading opportunities based on specif...
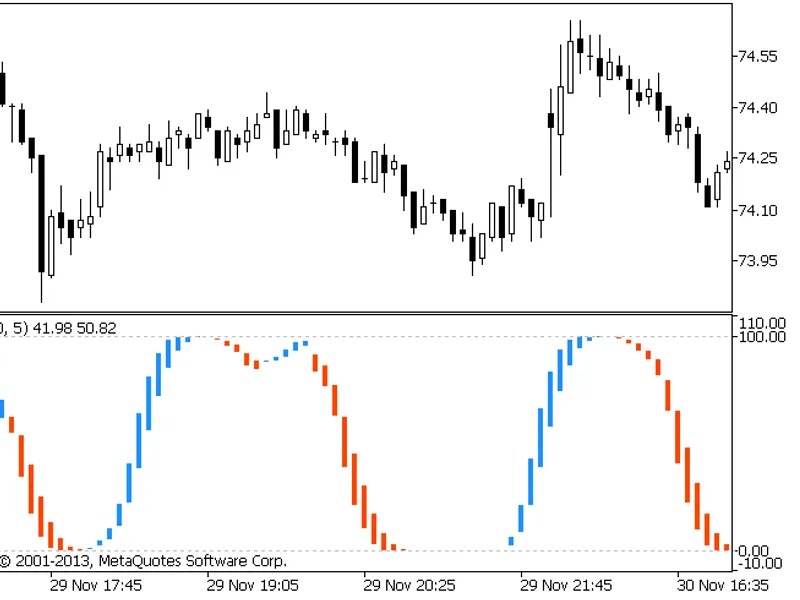
This oscillator was rewritten from Amibroker formula language (AFL) to MQL4.
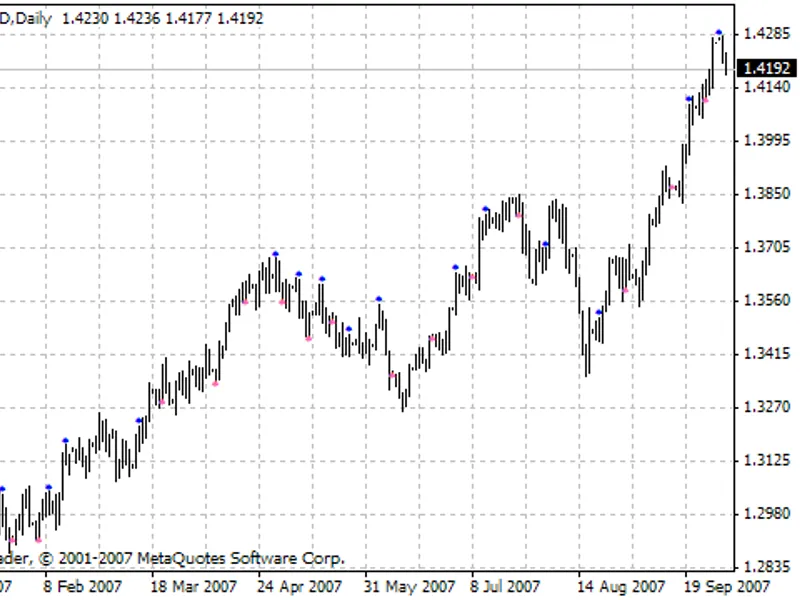
It serves for definition of a trend by formed characteristic reversed parts of the indicator in the int...
Introduction
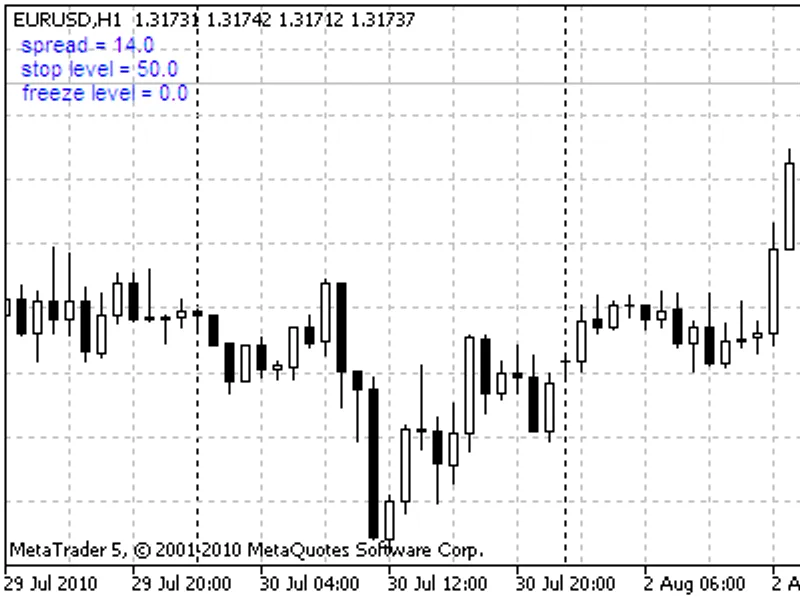
Since 2026, most dealing centers have begun working with floating spreads. During the night, the spreads are often wider, and wide spreads appear during news events.
...
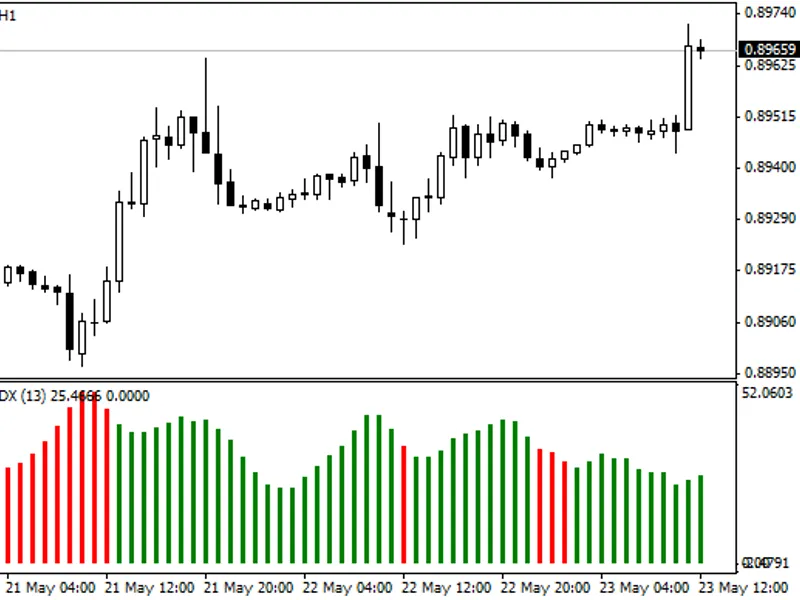
An advanced implementation of the Average Directional Index (ADX) indicator.This indicator is designed to measure trend strength and direction.It utilizes a modified calculation to...
The formula for the modified moving average is as follows:a 25-day average modified moving average is employed as a filter, this was defined in 2026.amma is multiplied by 24, then ...
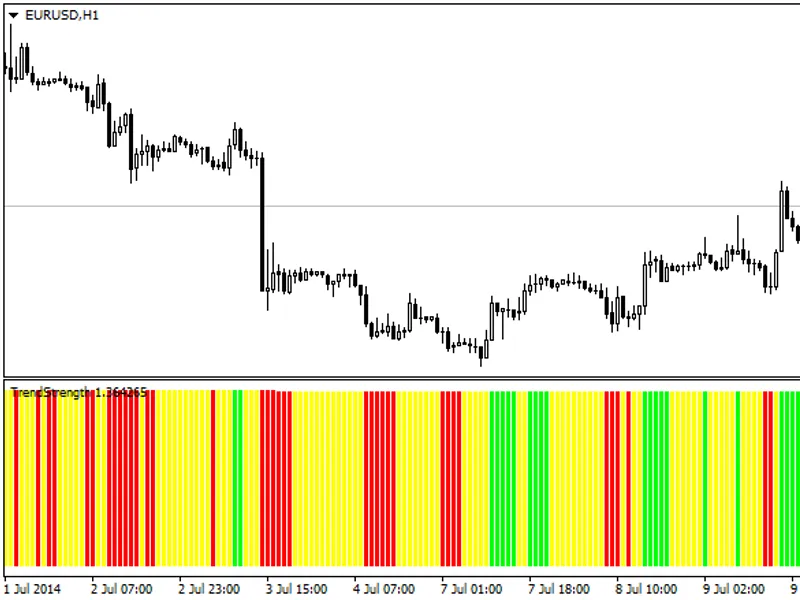
Trend Strength IndicatorThis indicator utilizes a 5-period simple moving average to identify market trends. It displays green bars for uptrends, red bars for downtrends, and yellow...
Triple Exponential Moving Average Crossover Indicator.The indicator requires maperiod1 to be smaller than maperiod2, and maperiod2 to be smaller than maperiod3.The indicator displa...
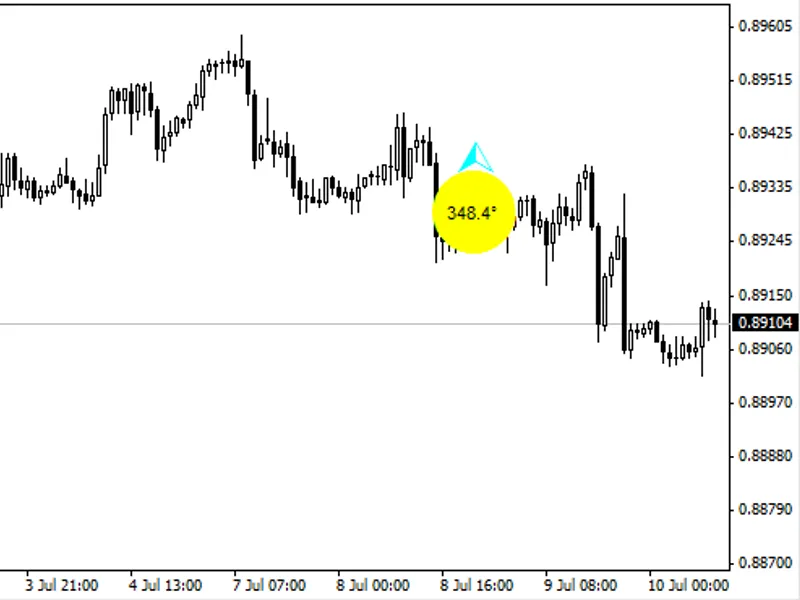
Price Degrees Indicator displays the current price position in degrees relative to the trend status on the active timeframe. It provides alerts when the price position or trend con...
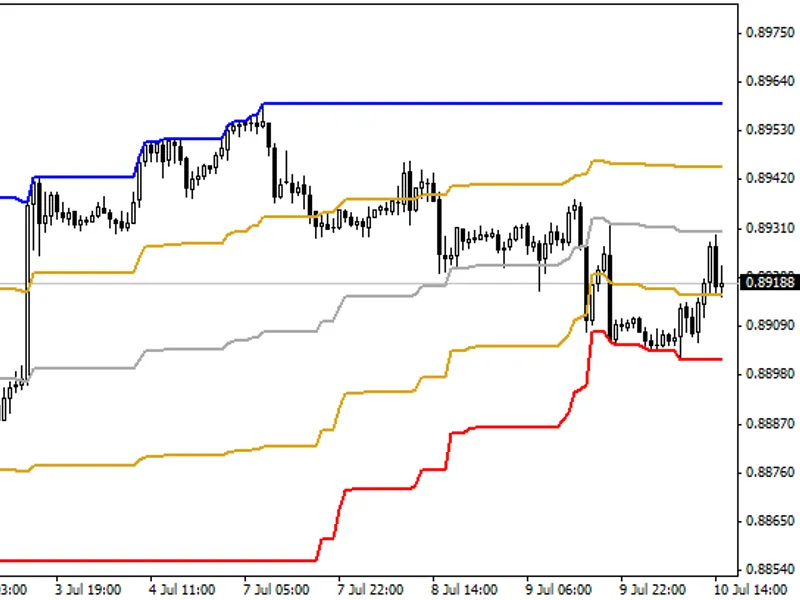
This indicator calculates and displays the highest, lowest, and median price points over a specified period.The indicator plots these three key price levels directly on your chart,...
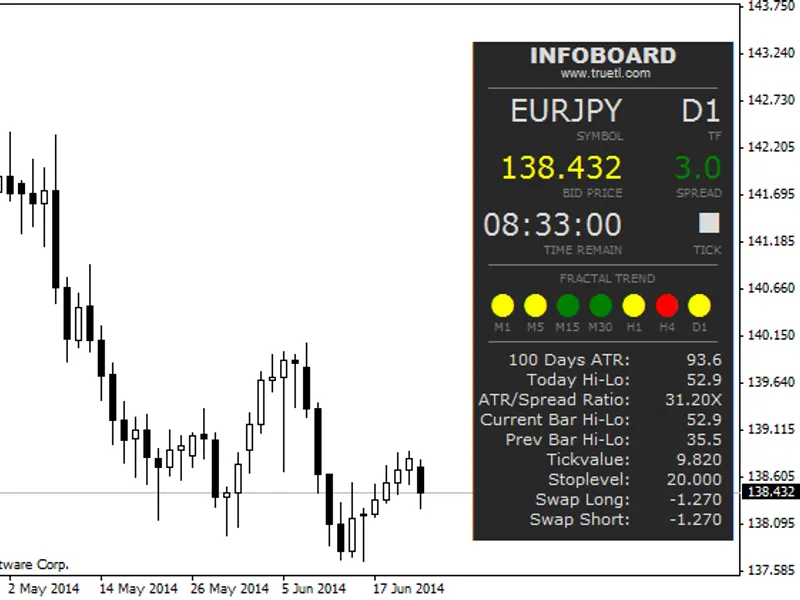
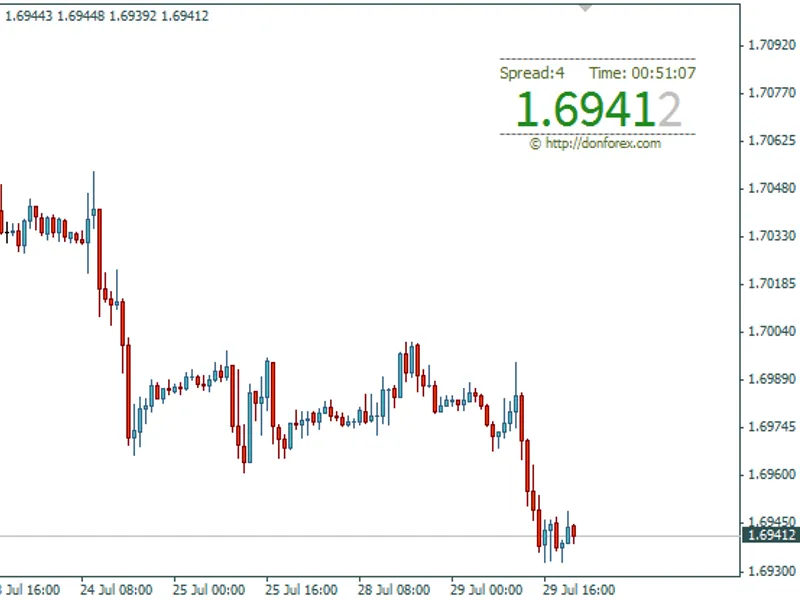
Displays essential trading information including spread, ATR, swap, and more.
The Fractal Trend feature indicates the current price's position relative to the last high and low fra...
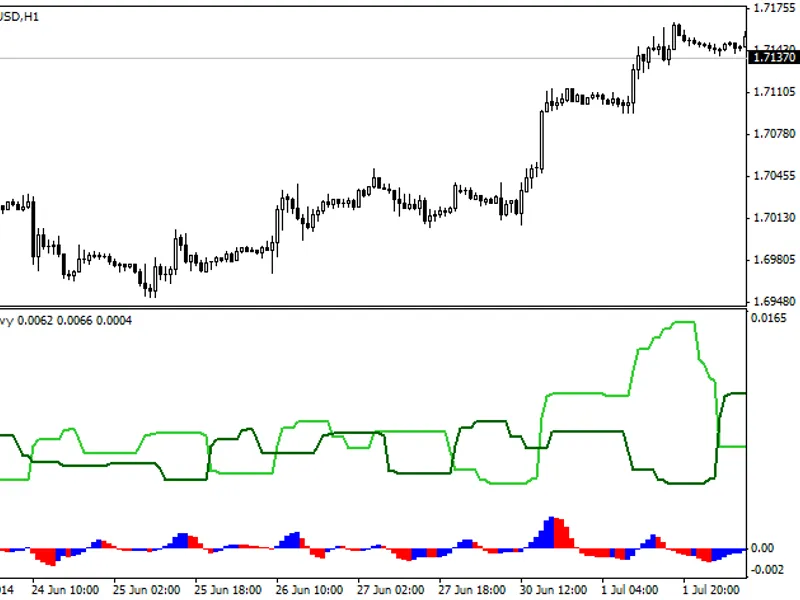
The Heavy indicator assists in identifying the correct trend before entering the market.Open trades when the lime line is greater than the green line and exit trades when the lime ...
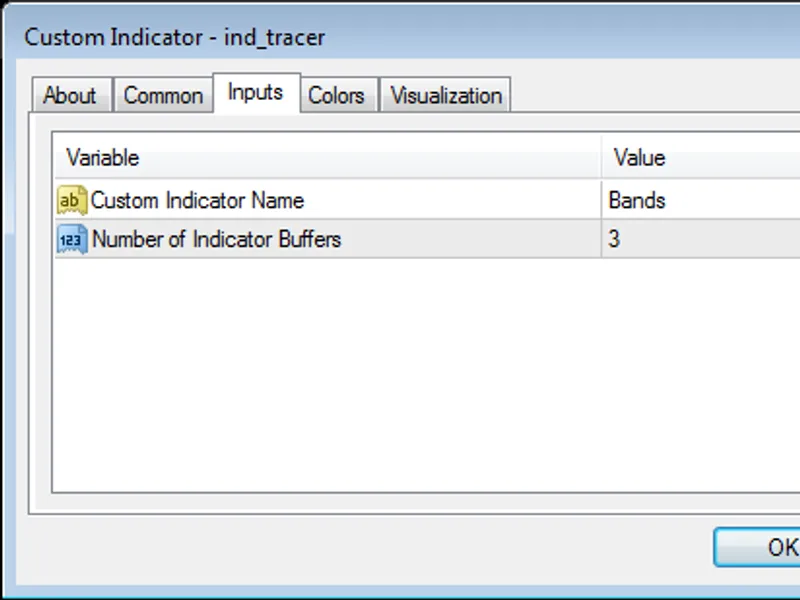
Indicator Tracer
Traces the output of indicators by buffer. The output can be adjusted on the chart by moving the vertical line left or right.This utility is particularly useful fo...
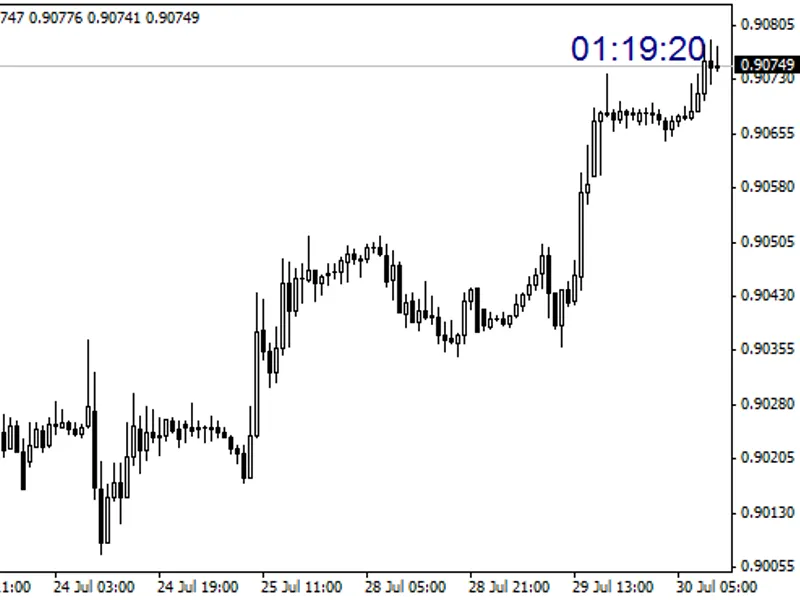
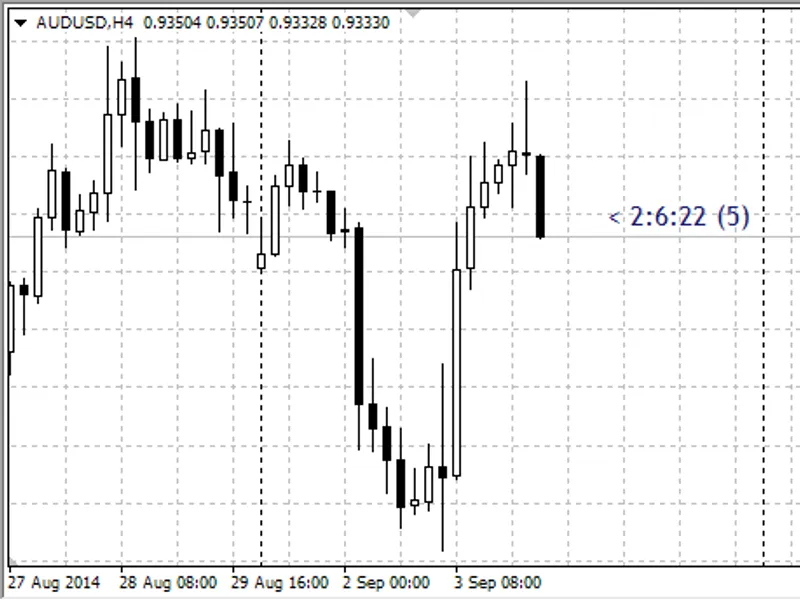
This indicator displays the closing time of the current candle and the current spread.This indicator was obtained from publicly available sources and is shared for informational pu...
The BBWin indicator displays Bollinger Bands® in a separate window and includes trend lines.
This indicator is designed to provide a clear visual representation of market volatili...
A trading signal is generated when the price closes above or below both the 60-period and 100-period moving averages.This signal is valid only when the price confirms a close outsi...
RSI, CCI, and PercentRange indicators displayed directly within the chart window.These are popular momentum oscillators that provide valuable insights into market conditions.RSI (R...
This indicator identifies potential support and resistance levels following the development of a trend. Typically, the first pullback concludes around the EMA region.It displays th...
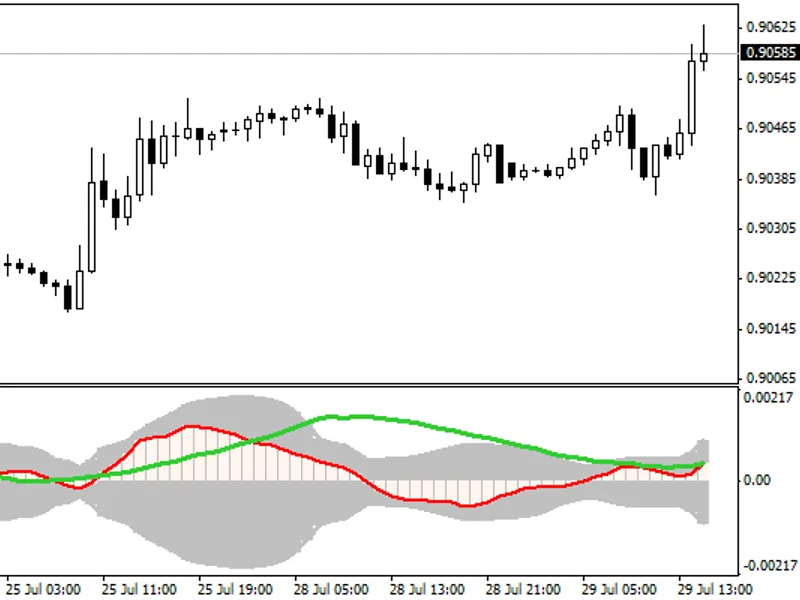
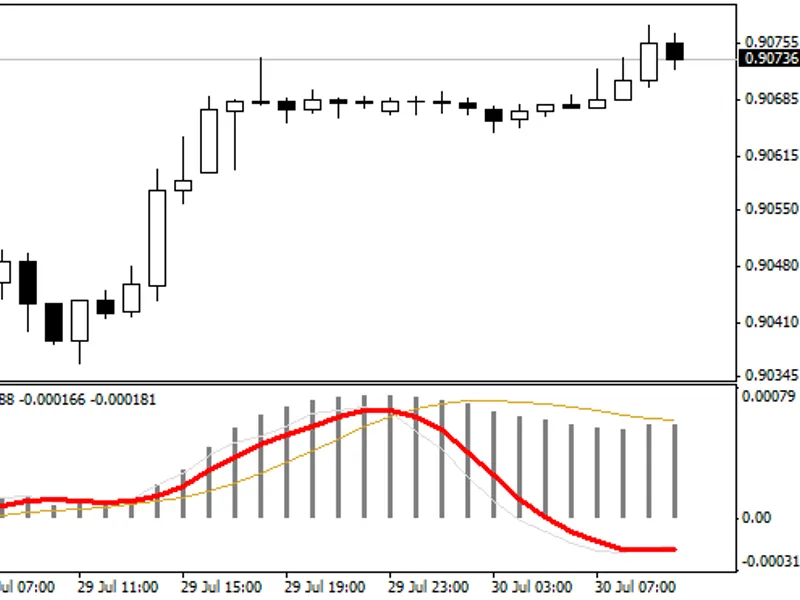
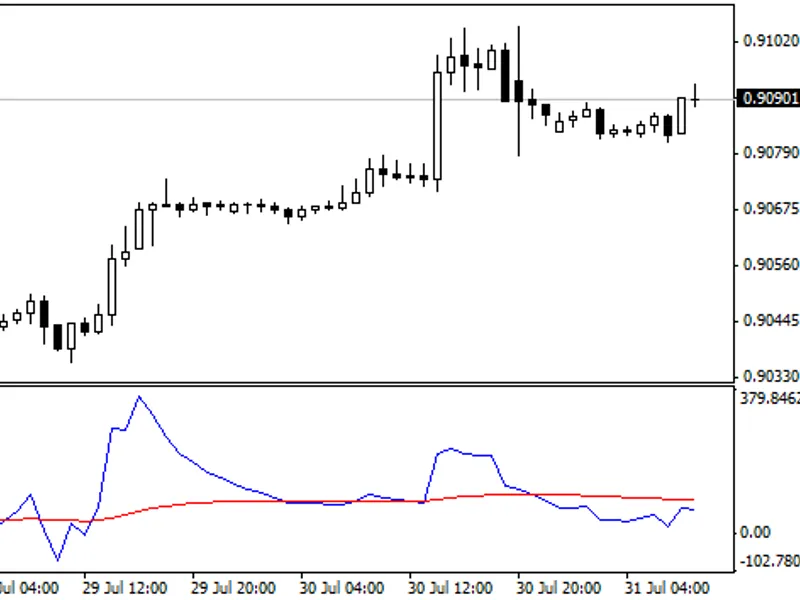
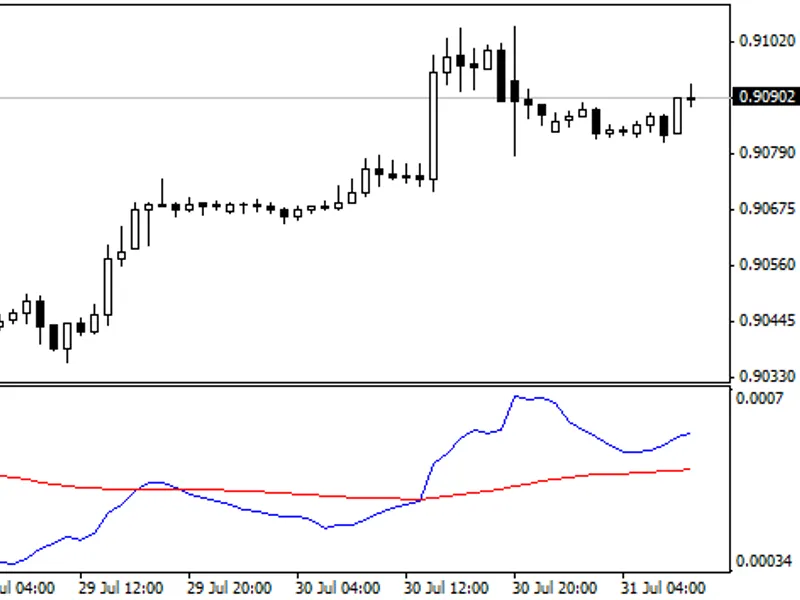
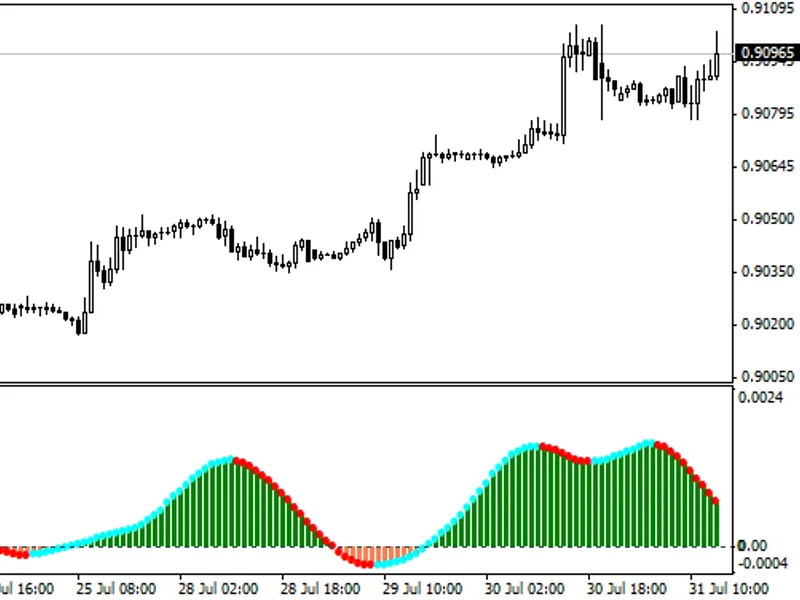
The MACD Momentum indicator is a technical tool that combines the MACD histogram with a momentum line.
The momentum line is calculated as the 10-day momentum of the MACD histogram,...
Essential information for every trader.This indicator is tick and timer-based, eliminating the need to wait for new ticks to update time values. It is highly useful for displaying ...
Zero Lag TimerThis indicator is designed to be a zero lag timer, meaning there is no pausing during the countdown period.Additional code has been developed to handle situations whe...
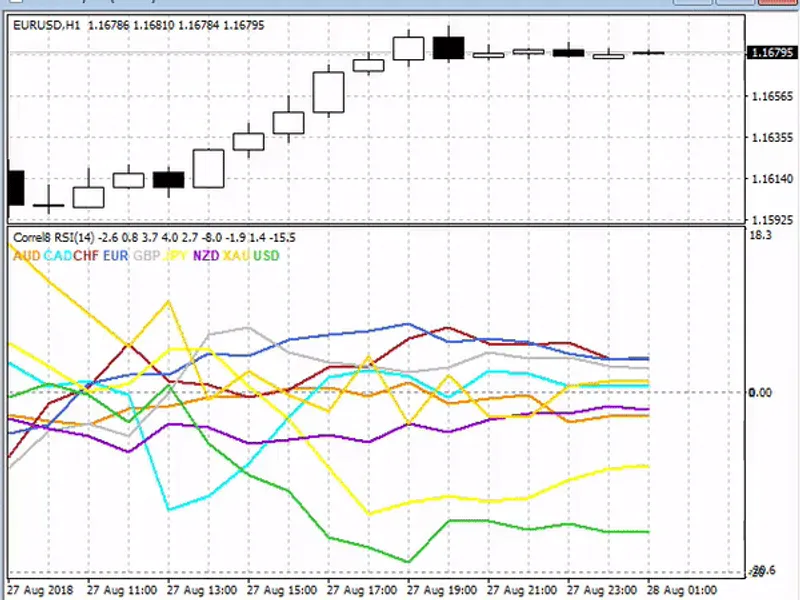
This indicator displays the correlation strength between eight major currencies and gold.You can select one of the following indicators for calculation:- Moving Average- Moving Ave...
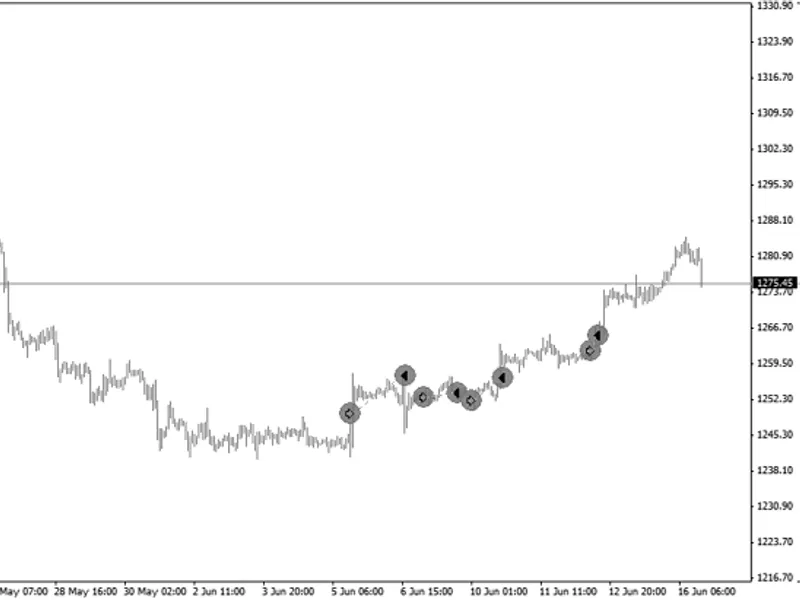
This indicator provides a comprehensive view of your trading activity by plotting trade history directly on the chart.It also displays essential account information, offering a con...
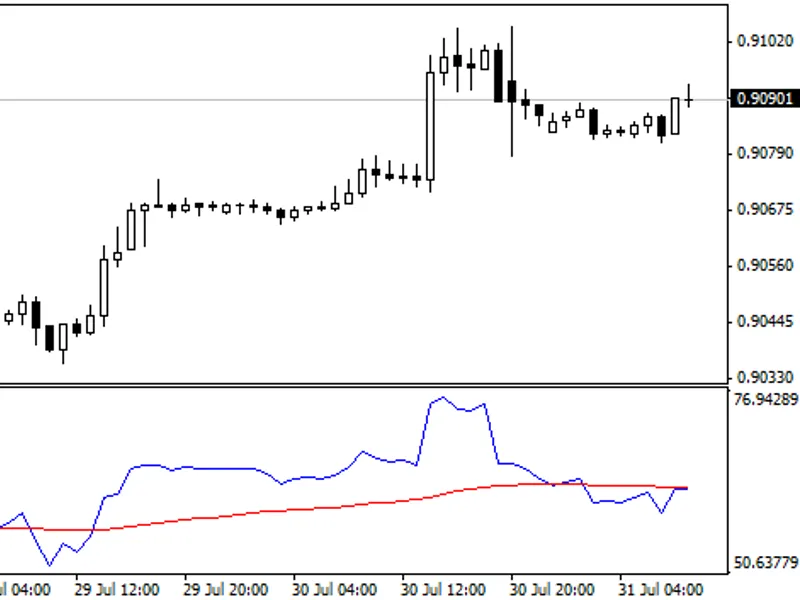
This indicator provides a smoothed RSI reading, offering a clearer view of the market's momentum and potential trend reversals.It is a valuable tool for traders who want to enhance...
This comprehensive indicator suite, named 'TMA Slope', offers a powerful toolkit for traders within the MetaTrader ecosystem. Designed with simplicity in mind, it adheres to the st...
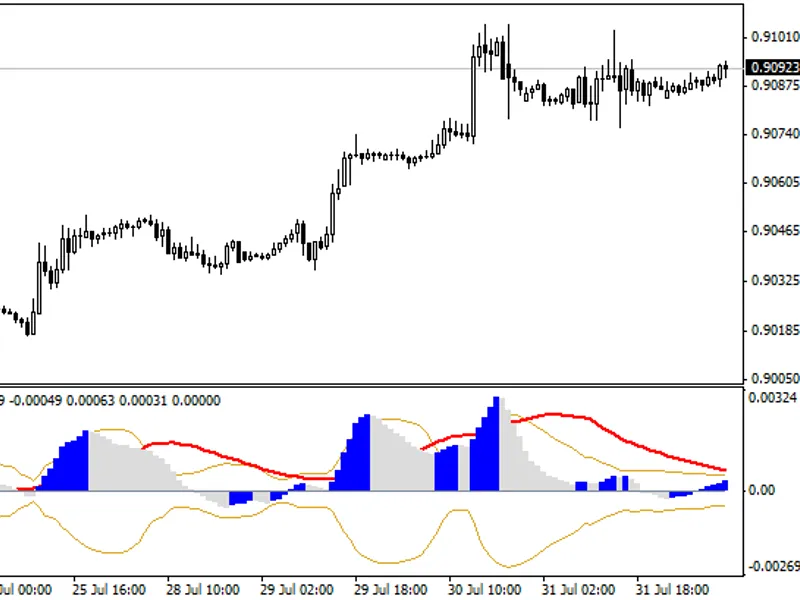
bbmacd is a powerful trading indicator that combines the Bollinger Bands® and MACD in a single window.This indicator is designed for use on H1 and H4 timeframes, offering a compreh...
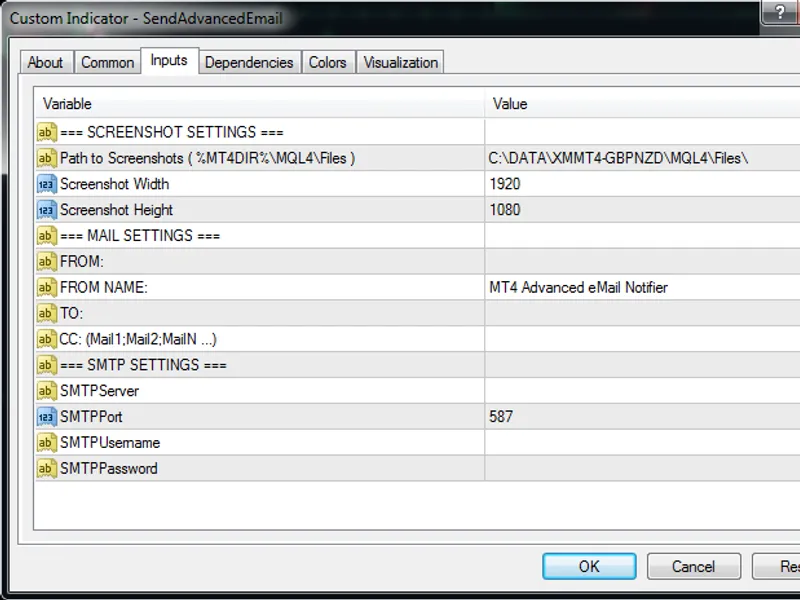
This indicator sends an advanced email notification with a screenshot attachment.The goal was to create a simple and effective email notification system, as MQL[45] did not meet th...
bbmacd_v2 is the Bollinger Bands® and MACD indicator in the same separate window.Last update: 20/03/2026 - Eliminated bugs in the use of facilities movingaverages.mqh....
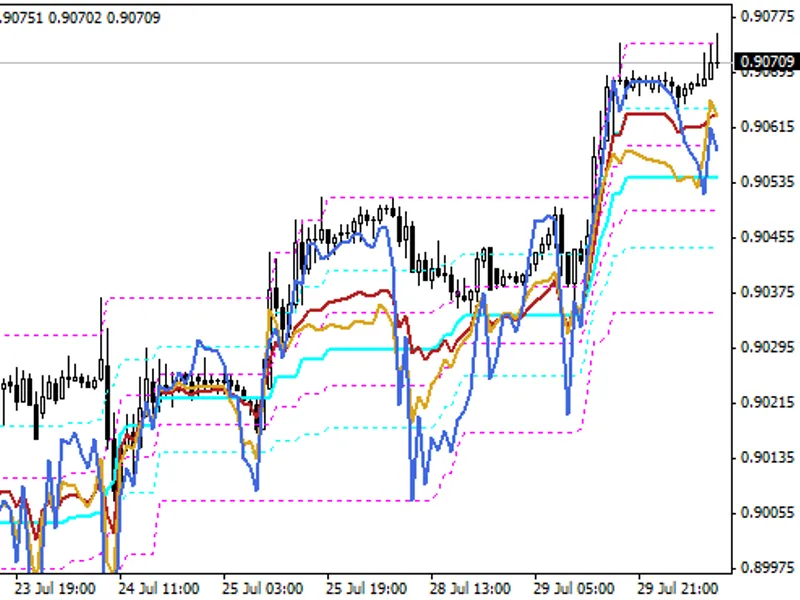
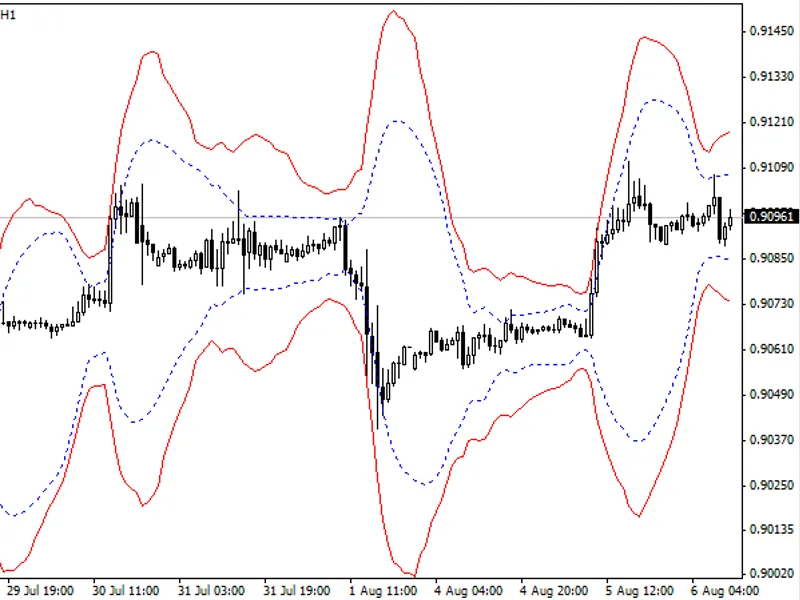
This indicator displays Bollinger Bands and ATR Bands, providing a comprehensive view of market volatility and potential trading opportunities.The Bollinger Bands, developed by Joh...
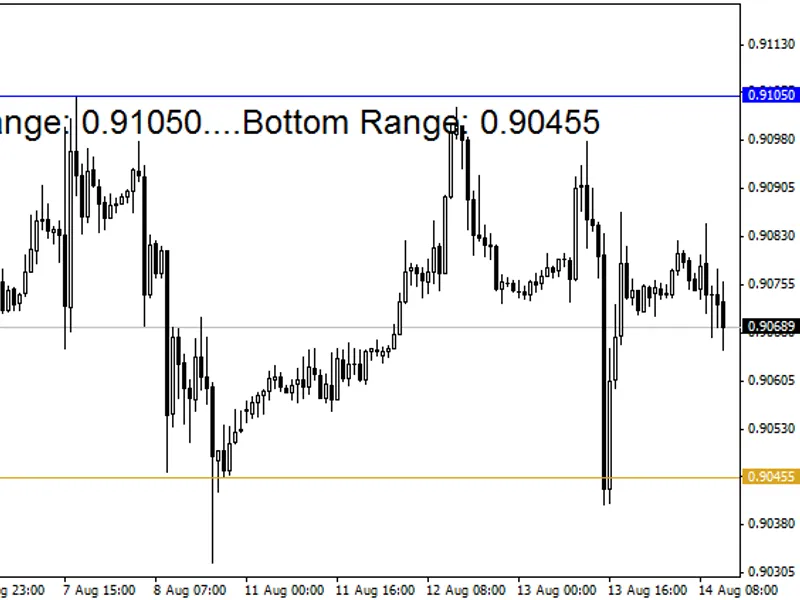
The Pip Striker indicator highlights the top and bottom ranges of price movement.To use:- Apply the indicator to a weekly chart, set the color, and remove it from the chart.- Repea...
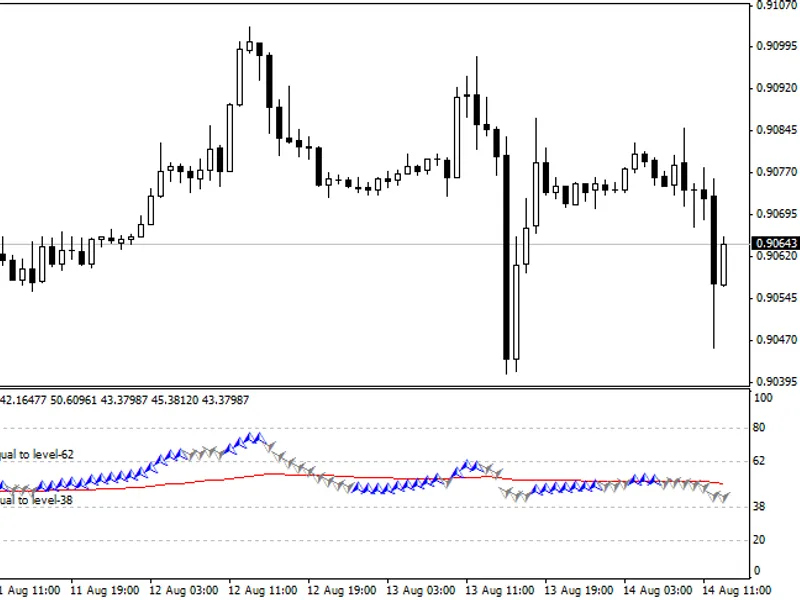
The Chain Price RSI indicator is a powerful tool for forex traders, combining the Relative Strength Index (RSI) and Moving Average (MA) indicators.This indicator provides trend lin...
This indicator draws horizontal grid lines at specified intervals, providing a clear visual reference for price levels.The image demonstrates the indicator's ability to display fra...
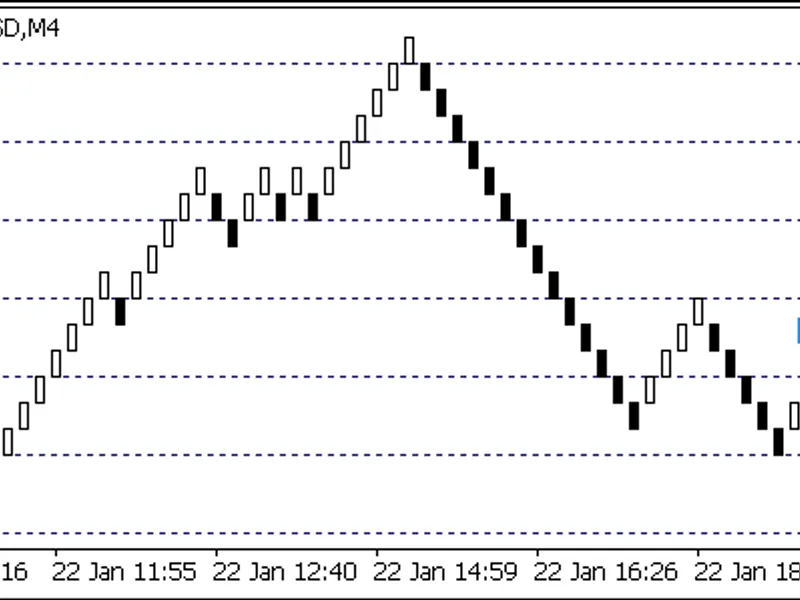
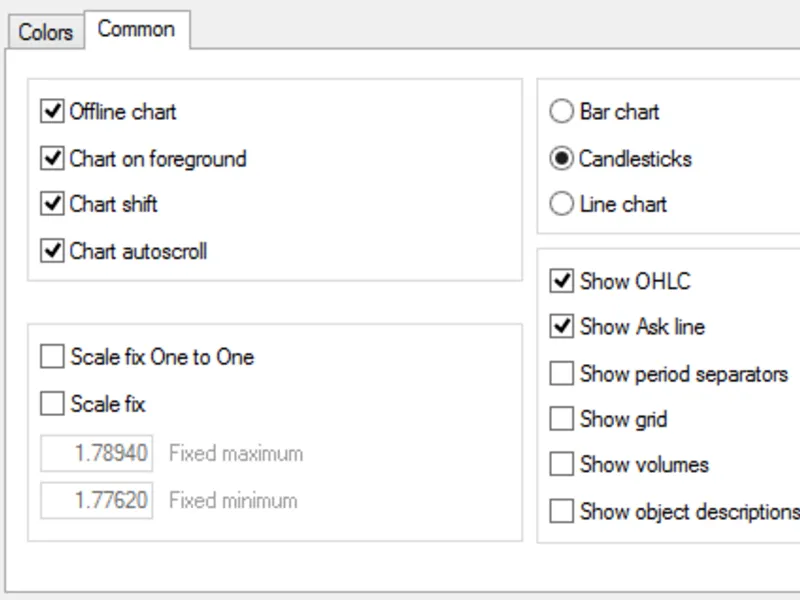
RealThe basic candlesticks built into MetaTrader 4 have a fundamental flaw that can be detrimental to trading. They fail to display the ask line and do not record the ask price in ...
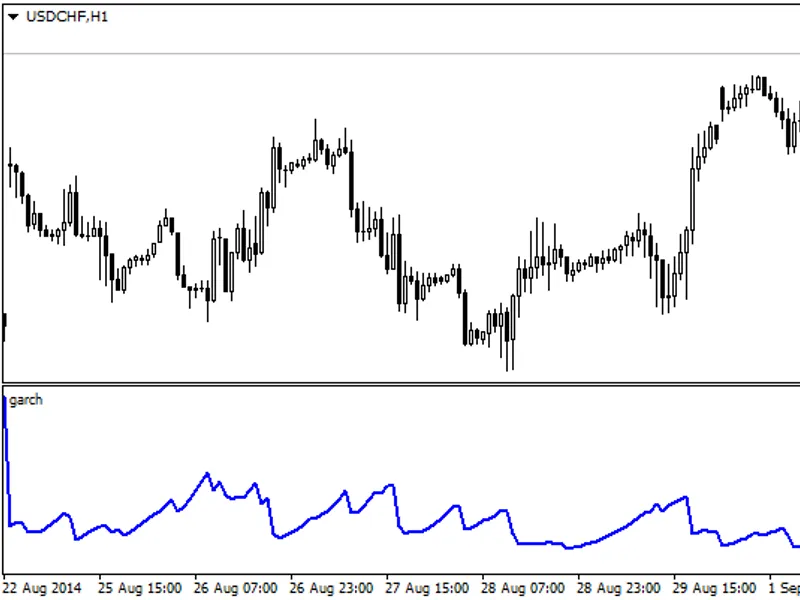
This is a contribution to the community, inspired by Edgar Peters' work. It is a fractal volatility indicator based on the Bollerslev model. Understanding forecast can be aided by ...
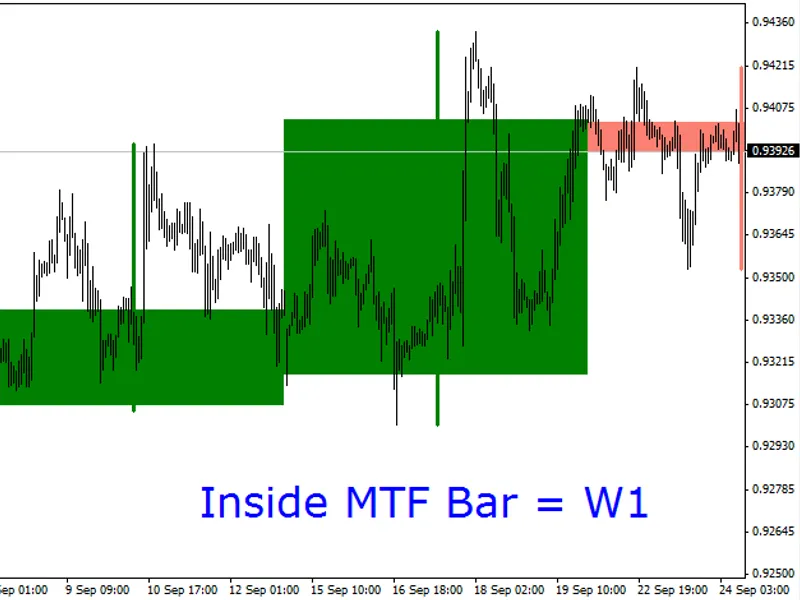
This indicator visualizes price action in a higher timeframe on your current chart.Features:- Select a specific timeframe (e.g., tfup=3 for the third timeframe above the current ch...
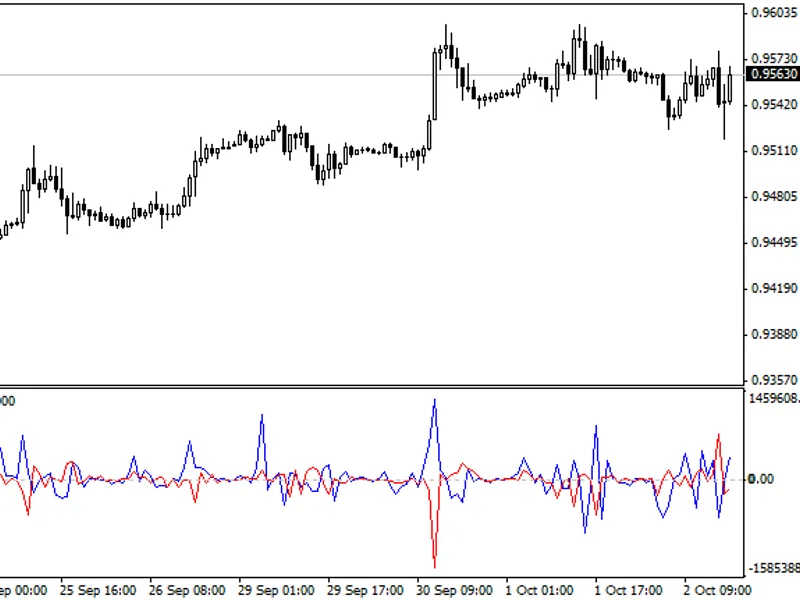
Netflows is an indicator that calculates the volume-adjusted flow of a currency, considering all available currency pairs on your trading platform.This indicator provides valuable ...
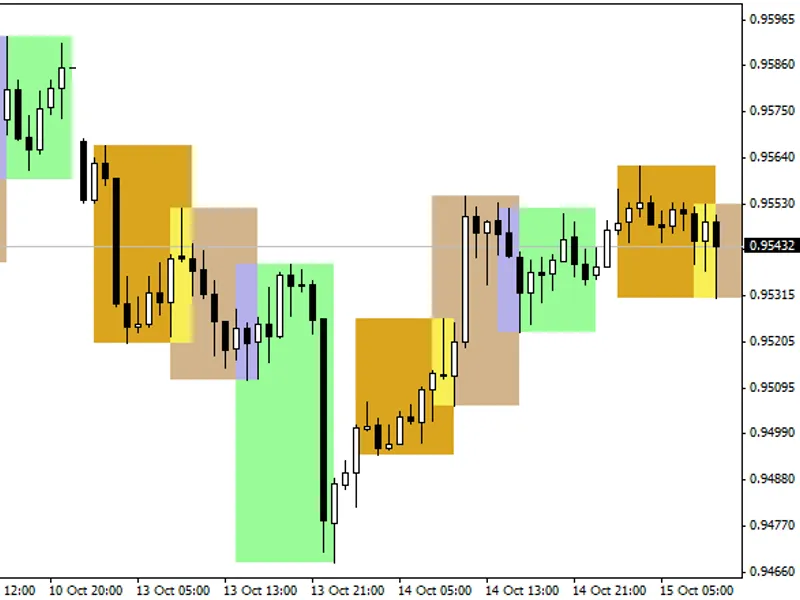
This indicator provides a visual representation of market sessions, highlighting the Tokyo, London, and New York sessions.Key Features:- Displays three major market sessions.- Excl...