Graphic Panel Contest
This professional-grade solution for MetaTrader 5 helps traders achieve greater efficiency in their daily workflow. This Expert Advisor serves as automated trading software. It is utilized to monitor financial markets and execute trades based on predefined algorithmic rules, enabling precise position management without the need for constant manual oversight.
How to Setup and Use Graphic Panel Contest
1. Installation: Open the "File" menu, select "Open Data Folder," navigate to MQL/Experts, paste your file, and restart the terminal.
2. Activation: Drag the EA from the Navigator onto a chart, ensure "Allow live trading" is checked in the Common tab, and verify the AutoTrading button is green.
3. Optimization: Right-click your chart, choose "Expert List," click "Properties" to adjust inputs, and save your preferred setup as a set file for future use.
4. Maintenance: Regularly check the "Experts" tab in the terminal window to monitor trade logs and potential execution errors.
Frequently Asked Questions
Q: Why is my EA not opening trades? A: Check the "AutoTrading" button, ensure "Allow live trading" is enabled, and verify your broker allows automated trading on your account type.
Q: Can I run multiple EAs on one chart? A: No, each chart can only host one active EA; however, you can open multiple charts for different currency pairs to run several EAs.
Q: What does the "smiley face" icon mean? A: A smiley face in the top-right corner of the chart indicates the EA is successfully running; a frowny face means it is disabled.
Description & Settings
Graphic Panel Contest Submission.
Code:
Source code and presentation is attached as ZIP file.
Hints:
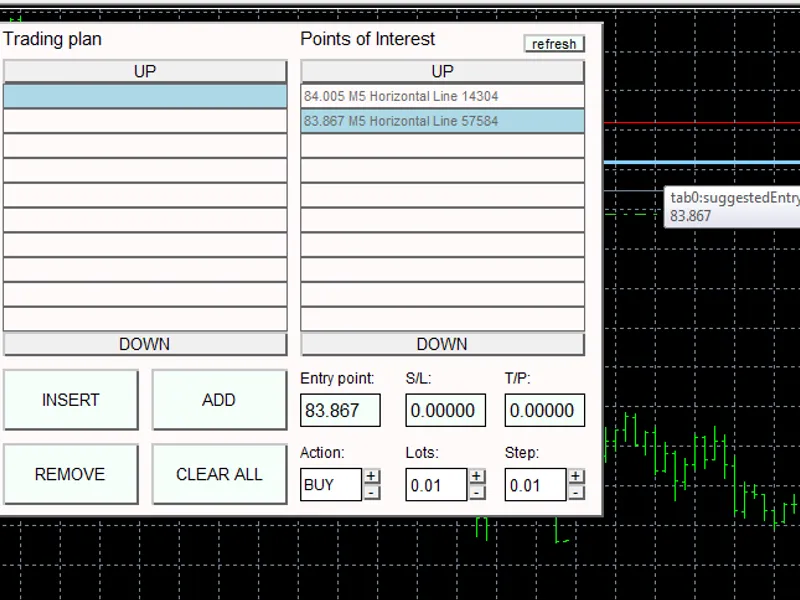
1) Setting take profit and stop loss levels can simply be done by dragging BLUE line (suggestedEntryLine). TP and SL is set automatically depending on Action type (BUY or SELL) and entered into S/L and T/P fields. It can be corrected by dragging blue line once more, or simply by putting a new value inside S/L or T/P edit fields (double click to edit, Enter key to confirm changes).
2) MTF indicator module uses indicator values from timeframes M1 to MN1. You may observe that not all rectangles display indicator values when you run this module on fresh MT5 installation. This completely normal and is due to to the fact that history data is downloaded by the terminal. After all history is downloaded module displays all values correctly and indicator values are updated on tick by tick basis (this may serve as reading of the 'mood' of the market).
3) Points of Interest list is built from:
any Horizontal lines;
any Fibonacci retracement levels;
any PIVOT points (put by PIVOT module).
When you add additional lines when Trade Plan is opened it is sufficient to press 'Refresh' button to populate list with new objects.
4) Fibonacci calculator remembers lines in different timeframes, it is easy to switch between timeframes and choose which pivot to display. The calculator is based on web-based calculator available at
5) Please see videos in Demos section to see panel main features.
Demos:
1.
2.
3.
4.
;5.
Best Regards,
Investeo