Graphically display current trend for all time frames in one simple panel
This tool for MetaTrader 4 is specifically engineered to streamline your trading operations. This technical indicator acts as a specialized analysis tool designed to visualize market data. It helps traders identify emerging trends, momentum shifts, and key support or resistance levels by plotting statistical calculations directly onto price charts.
How to Setup and Use Graphically display current trend for all time frames in one simple panel
1. Installation: Place your file in the MQL/Indicators folder via "Open Data Folder" and restart your terminal.
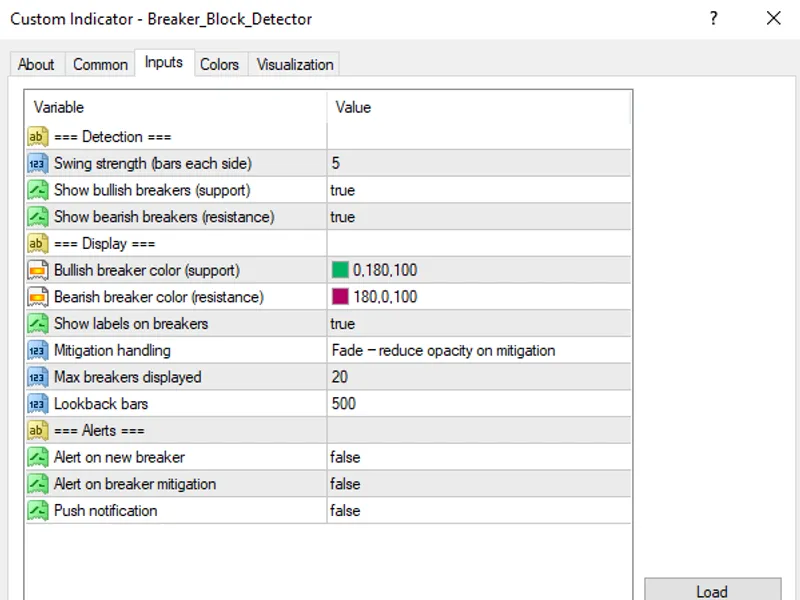
2. Loading: Find the indicator in the Navigator, drag it onto your chart, and configure the input parameters in the popup window.
3. Customization: Press Ctrl+I to open the indicator list, select your tool, and click "Properties" to change colors, levels, or visual styles.
4. Updating: Replace the old file in the Indicators folder with the new version and restart the platform to apply changes.
Frequently Asked Questions
Q: Why is my indicator not showing? A: Verify the file is in the MQL/Indicators folder, or try right-clicking the "Indicators" tree in the Navigator and clicking "Refresh."
Q: Do custom indicators slow down the platform? A: Too many complex indicators can impact performance; remove unused ones via the "Indicator List" (Ctrl+I).
Q: Can I use MT4 indicators on MT5? A: No, MQL4 and MQL5 are distinct languages; ensure the indicator is compiled specifically for your platform version.
Description & Settings
This is a graphical indicator based on slope-direction-trend indicator that has been published under several other forms.
One can search to see multiple results.
I have taken this indicator and made it into a graphical panel displaying all time frames and made a few slight modifications to the original code. One of them is that it allows the user to select the second moving average method used for smoothing. The original code used Linear Weighted for its second pass on the numbers whereas I give the user the option to choose the method for smoothing. When using Linear Weighted for both calculations, it makes the indicator too responsive and thus possibly giving false readings on the current trend. If we use Simple as the second averaging method we get a trend that is more indicative of where the price is going.
Another change that I have made is the ability to not only get the direction of the trend (up, down or flat) but also get its value. I will talk about this in another article I plan on publishing shortly on how to use a double SlopeDirection indicator and create a Expert Advisor with it.
But for now, let's take a quick look at the code. I first define all the object names I will use. The reason why this is good practice to do is that each time you put an object name between quotes, it allocates space in the program for it. So it they are defined once (by using a define statement) you only use up the space in your code once.
Next, I define two arrays. One with the pixel position for each of the 9 time frames and the second with the time frames. These are defined as global variables.
Our indicator OnInit() function calls a function to create the panel and the objects within the panel. It also does a quick "Dumn Dumn" check on the bars used to calculate the trend. Less than 3 is kind of pointless.
I will not get into details on how the GetTrend() function really works, there's already good documentation on this site for that. We'll just take a look at the graphical DisplayTrend() function.
Basically, we simply loop thru the TrendPeriods[] array (to get all time frames) and set the trend arrow according to that time frame's trend direction. If the trend is flat, we find the first direction that is not flat to know where the trend was coming from in order to display the side arrow in the color of that direction.
The Create_Panel() function in our OnInit() creates the objects anchored to the bottom left of the screens and uses TrendPosition[] to place the arrows in the right place.
This function will return TRUE if it succeeded in creating all the objects, or return FALSE if an error occurred creating an object. The nice thing is that the indicator will display in the EXPERT tab of your console the error code and the line number of the code where the error occurred.
We also need to update the trend indicator for each new tick we receive. This is done by calling DisplayTrend() in our start() function.
Lastly, we destroy all objects created by the indicator when we close the indicator.
That's basically it. You now have a nice indicator panel showing the current trend for all time frames in the lower left of your screen.
Enjoy!