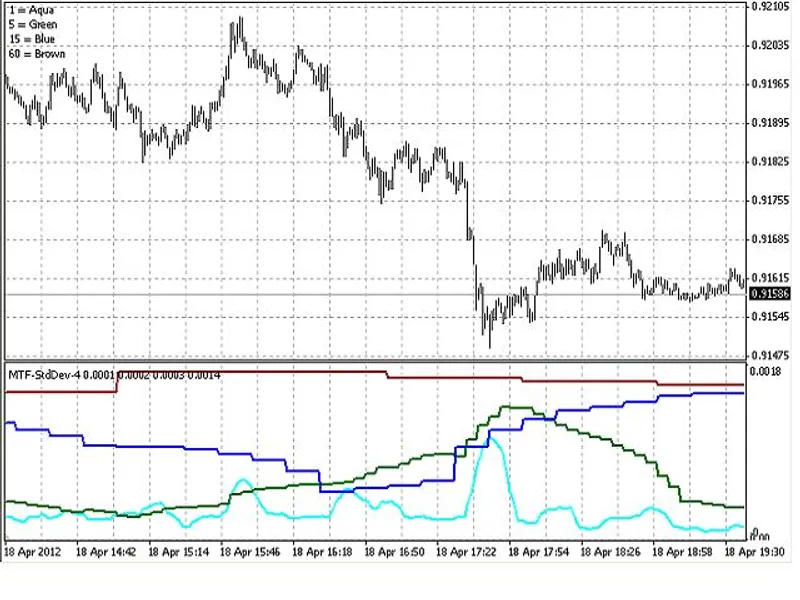
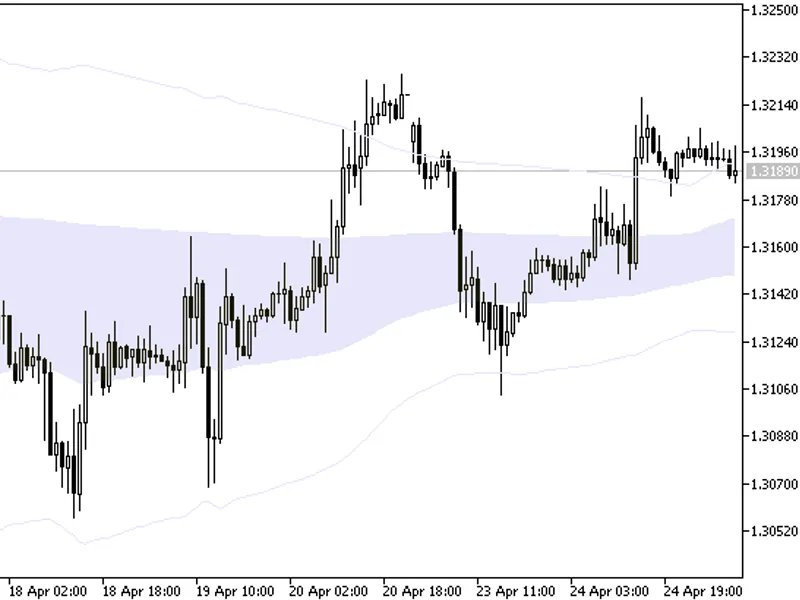
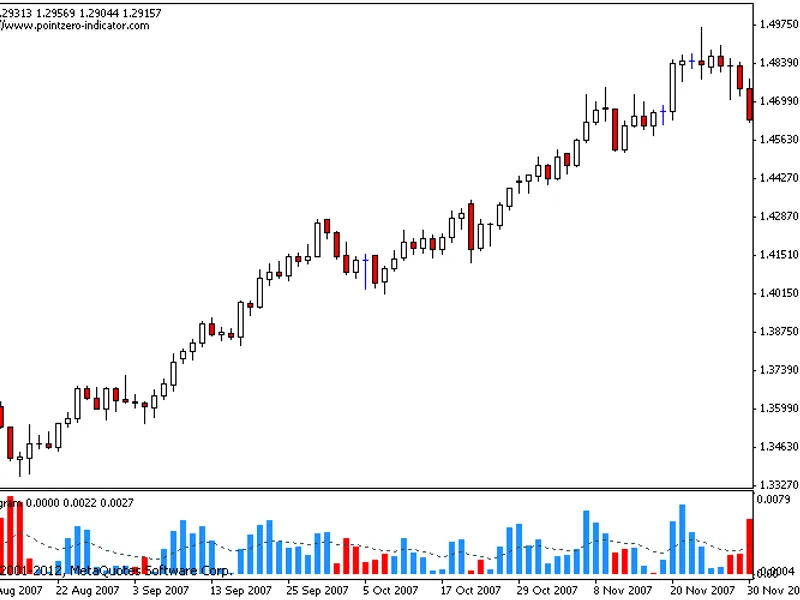
This indicator is based on the classical indicator Standard Deviation.You can choose the Standard Deviation from 4 timeframes: 1 current timeframe and 3 additional timeframes of yo...
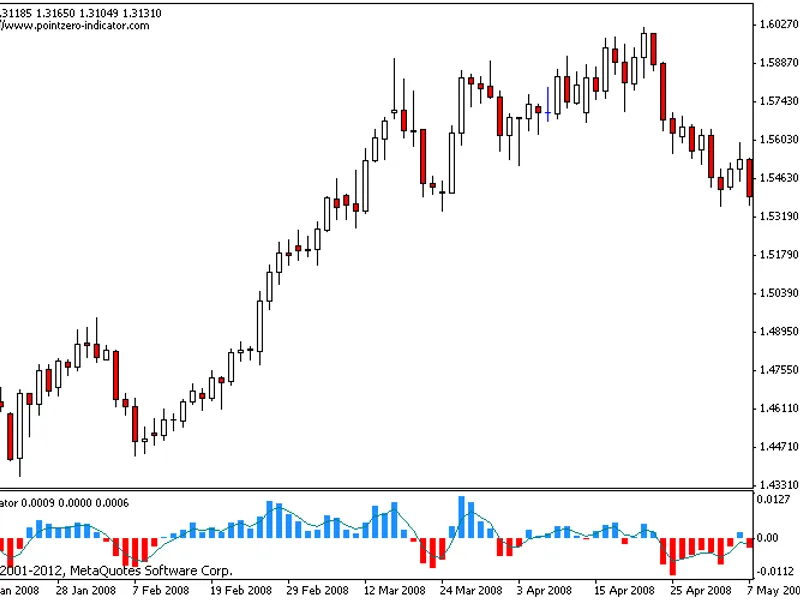
The Heiken Ashi Oscillator is a powerful tool that displays the color of Heiken Ashi bars and measures immediate and average change over time. It simplifies the visualization of ca...
This indicator demonstrates the utilization of a free library for custom chart integration, enabling seamless connection to custom charts generated from custom history files.The in...
After launching the indicator, a unique channel with three lines will be displayed, setting it apart from the standard channel with its middle line.The black line can be adjusted, ...
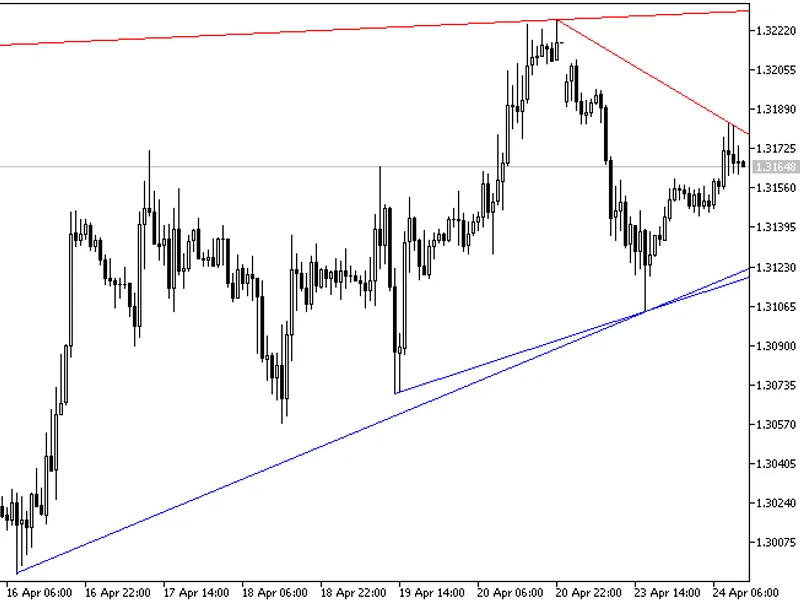
This indicator is a valuable tool for traders, regardless of their strategy. It identifies support and resistance lines, providing crucial information for making informed trading d...
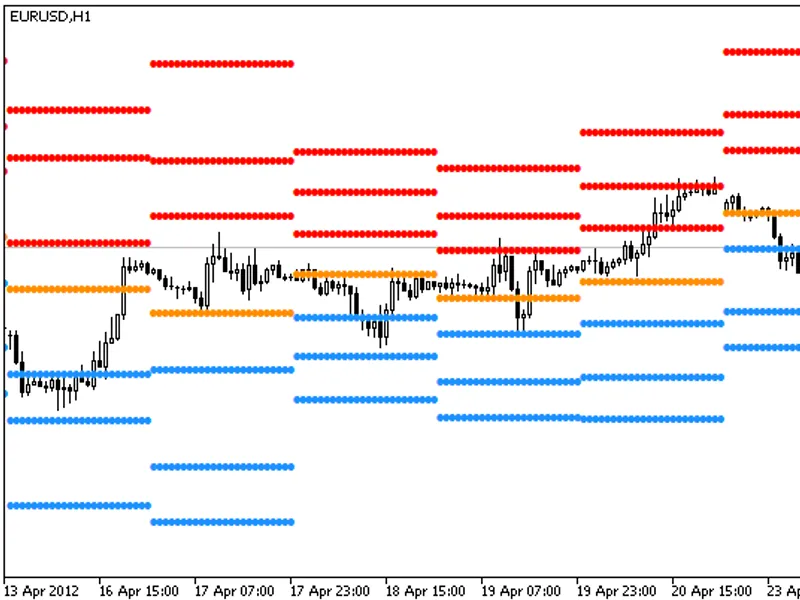
The Pivot Point indicator is a classic tool that displays the pivot point and three resistance and support levels for each data point.Calculation Periods:- Day- Week- Month...
This indicator calculates values similar to those of the Williams Percent Range indicator for five different periods, presenting them as a histogram. The histogram forms distinct p...
Updated on 21-May-2022: Below are the changes done in v1.1:- Bar adjustment: Now it considers the two previous bars for trend determination.- Alert added.The MACFibo trading strate...
This indicator displays the color of the Heiken Ashi candles and the rate of immediate change on a histogram, with a moving average representing the average change. When Heiken Ash...
This is a set of four indicators named 'Session Open V-Line Indi'. Designed for the MetaTrader platform, it offers reliable functionality to support traders. The indicators adhere ...
Logo: Description: The signals and stop loss/take profit can be disabled in the input parameters. The indicator with price levels, signals, and disabled stop loss/take profit is sh...
This trend following system is based on the strategy designed by Dennis Gartman and Bill Eckhart, which focuses on breakouts of historical highs and lows for trade entry and exit.T...
When the volatility of a financial instrument decreases below a certain level, long-, middle-, and short-term strategies may become unprofitable.The duration of this low volatility...
This trend-following system relies on breakouts of historical highs and lows for trade entry and exit, a strategy that challenges the traditional 'buy low, sell high' approach. Dev...
Description:The indicator provides a simple visual cue for potential trading signals. If the green line crosses above the red line, it may indicate a long position, and vice versa....
Indicators:
- Open Position Points
- Open Position Pips
These indicators are simplified modifications of the iexposure indicator.
Both indicators are identical in all functions e...
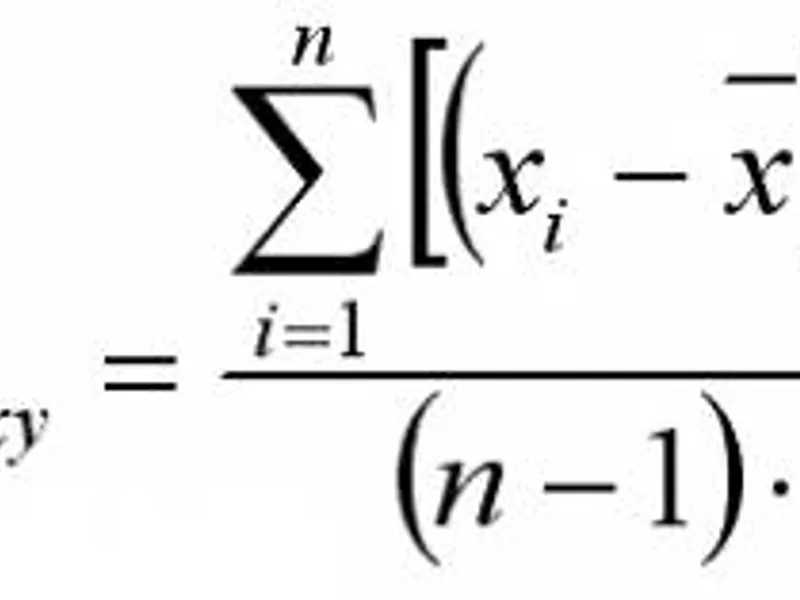
The Pearson Correlation Indicator displays the correlation between symbols, offering a valuable tool for traders to analyze market relationships.Input Parameters:Symbol- Name of th...
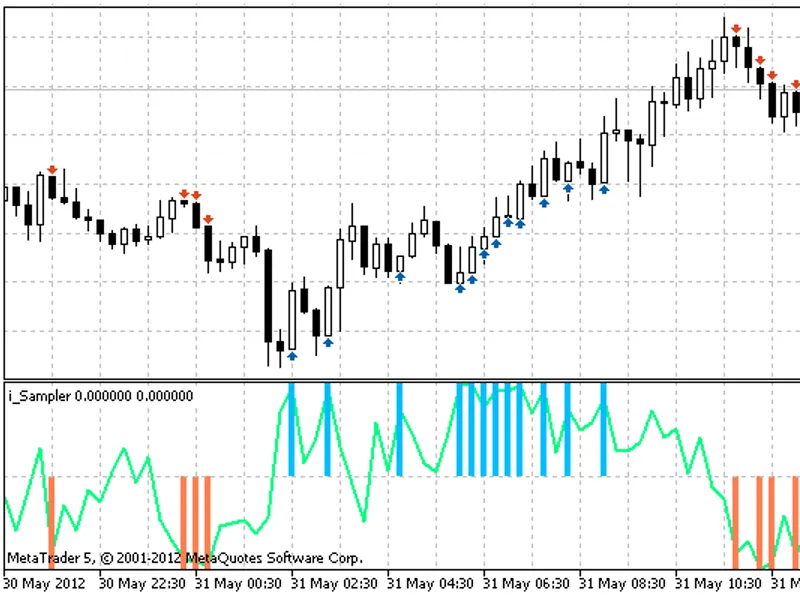
The i_sampler.mq5 indicator calculates market entry signals for neural network training.It features two buffers:- Buffer 0 (green line) - Analog signal, calculated as the ratio of ...
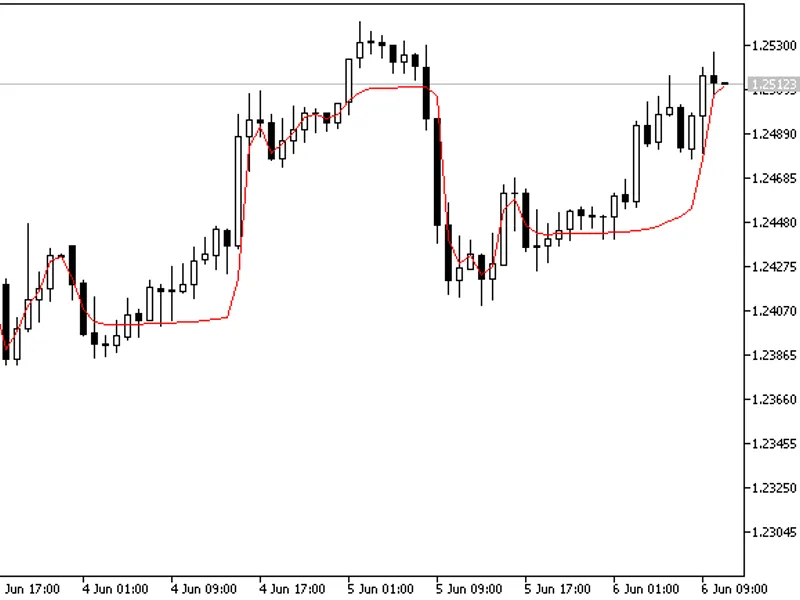
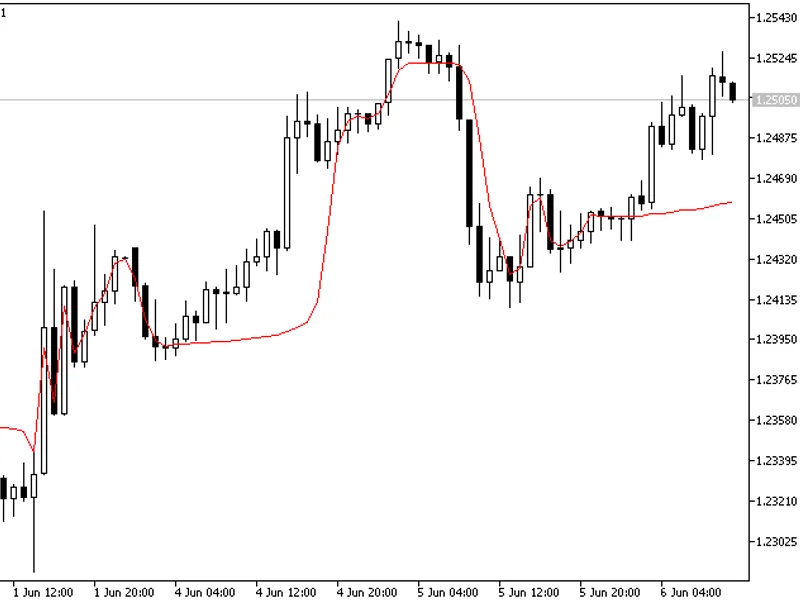
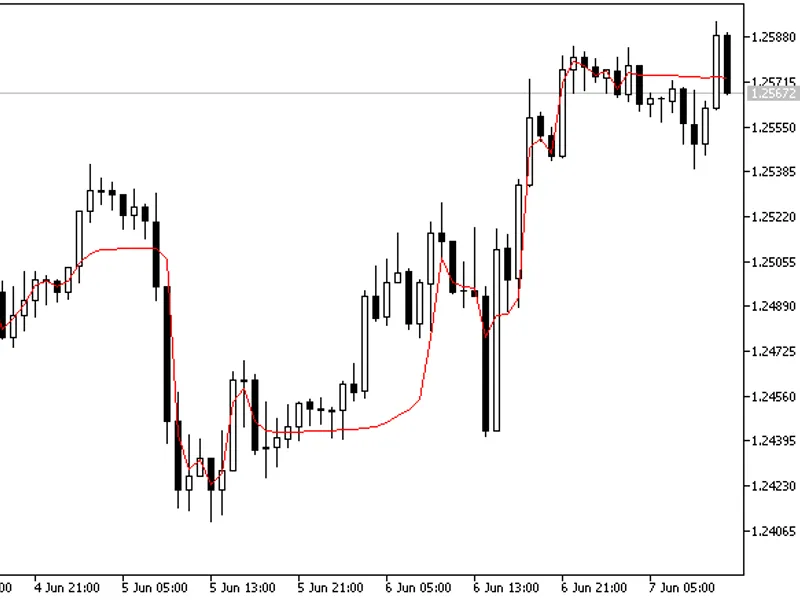
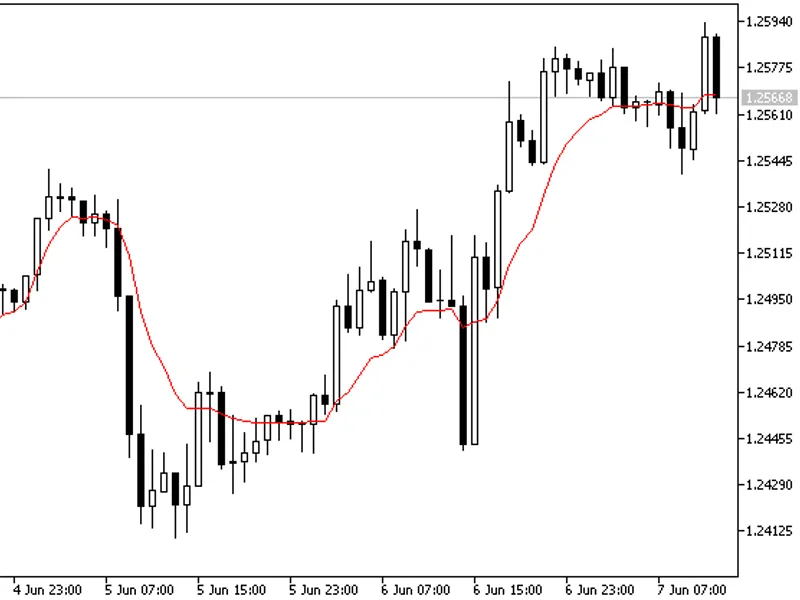
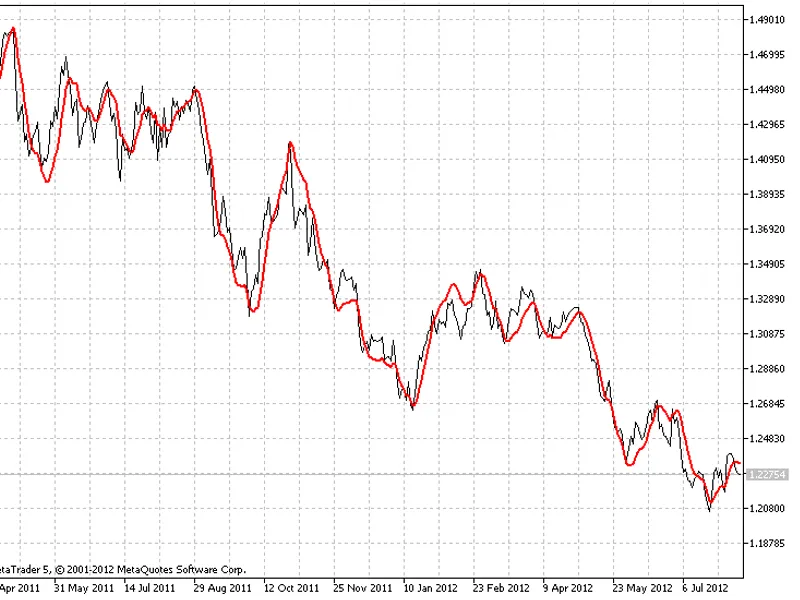
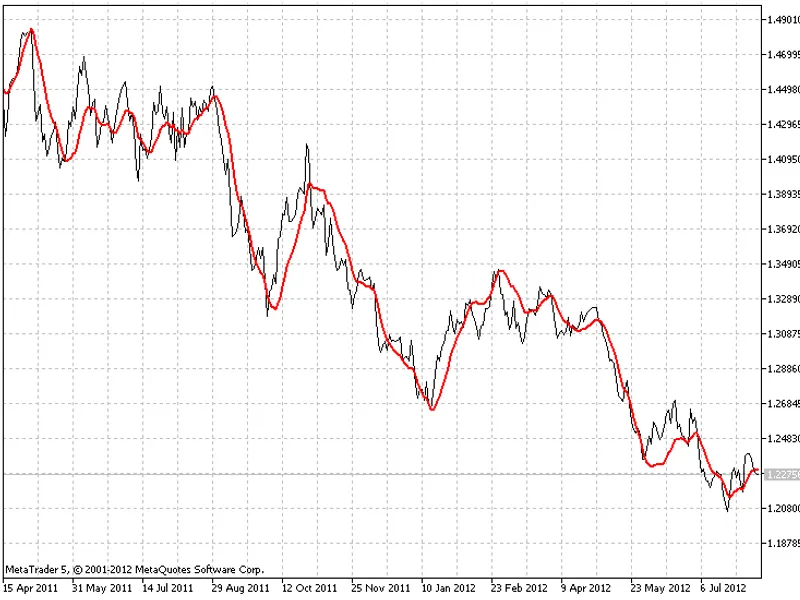
Adaptive exponentially smoothed moving average, based on an indicator.This indicator is similar to Bollinger Bands, but based on the standard deviation of the price instead of the ...
This indicator is an adaptive exponential moving average (AEMA) that adjusts its sensitivity based on the Average True Range (ATR) volatility.It was originally developed by Jose Si...
Exponential Moving Average (EMA) Volatility Adjusted.This indicator adjusts the EMA based on volatility, providing a more responsive and adaptable trend-following tool.Input Parame...
Exponential Moving Average (EMA) - Volatility-Adjusted.This indicator combines the Relative Strength Index (RSI) with an EMA to create a volatility-adjusted moving average.Input Pa...
Draws a horizontal line at the session open, allowing for flexible time inputs.This indicator is an enhanced version of the original, which only allowed for session starts on the h...
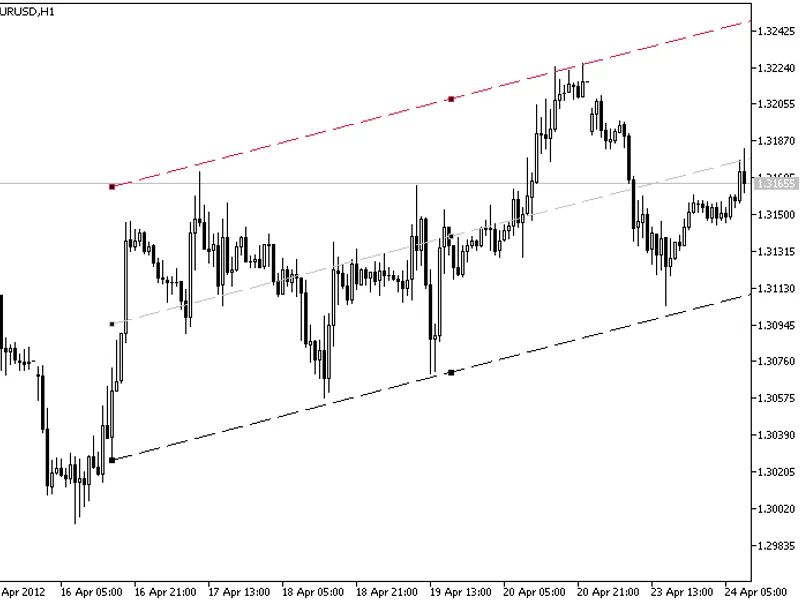
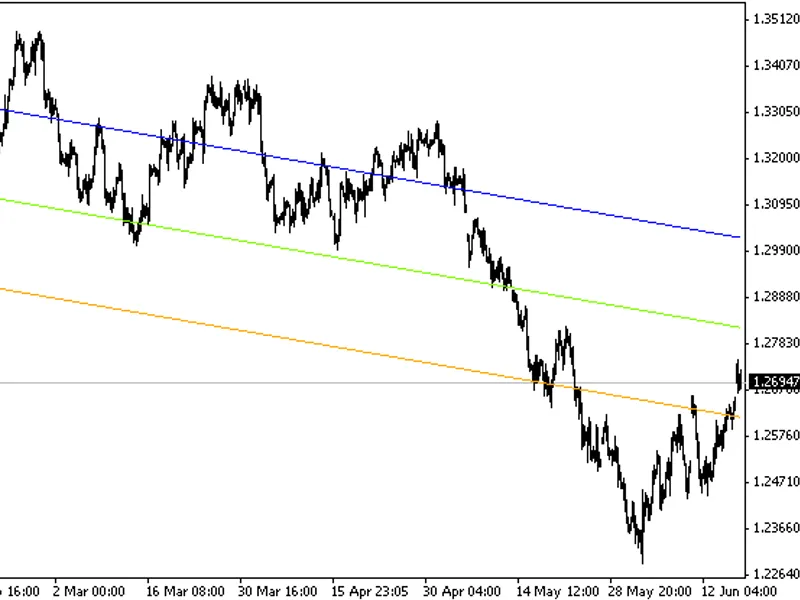
This indicator calculates a regression channel for a long period, with the number of candles as a variable and the standard deviation as the deviation variable.The indicator provid...
This is the standard MACD indicator, drawing two flat lines instead of a signal line.It is designed to detect and trade flat/range-bound markets.A simple tool, it was created to ru...
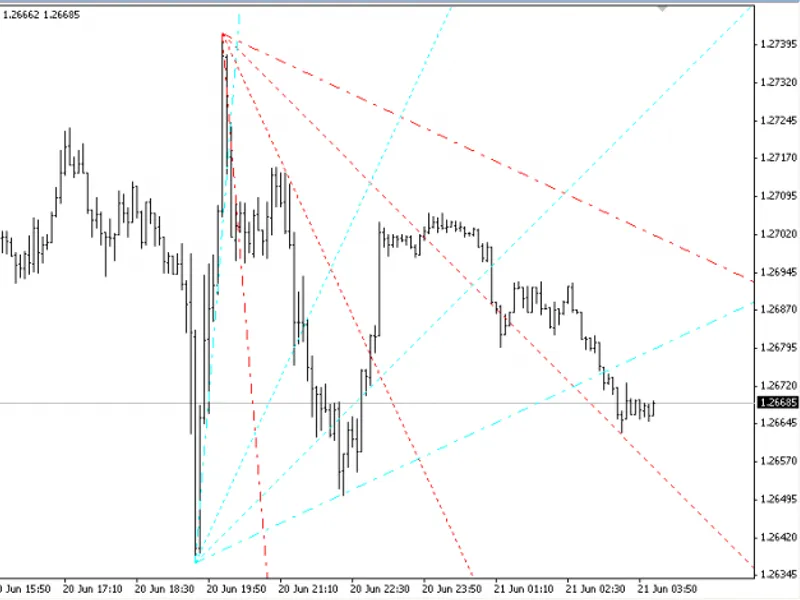
This indicator identifies the highest and lowest prices within a defined period and subsequently plots four angle lines at 25 to 85 degrees for price forecasting.The indicator prov...
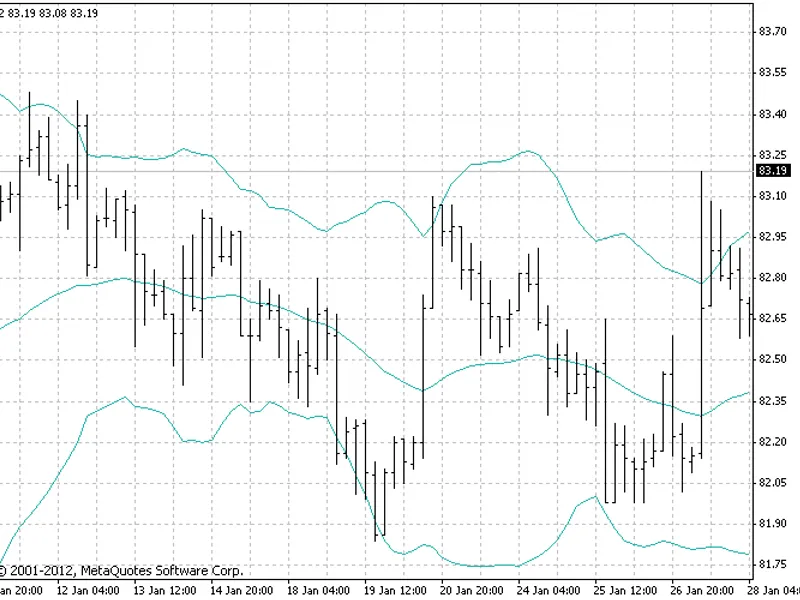
This indicator is a variation of the standard Bollinger Bands® indicator, offering more flexibility in input parameters.It allows you to choose from various moving average methods ...
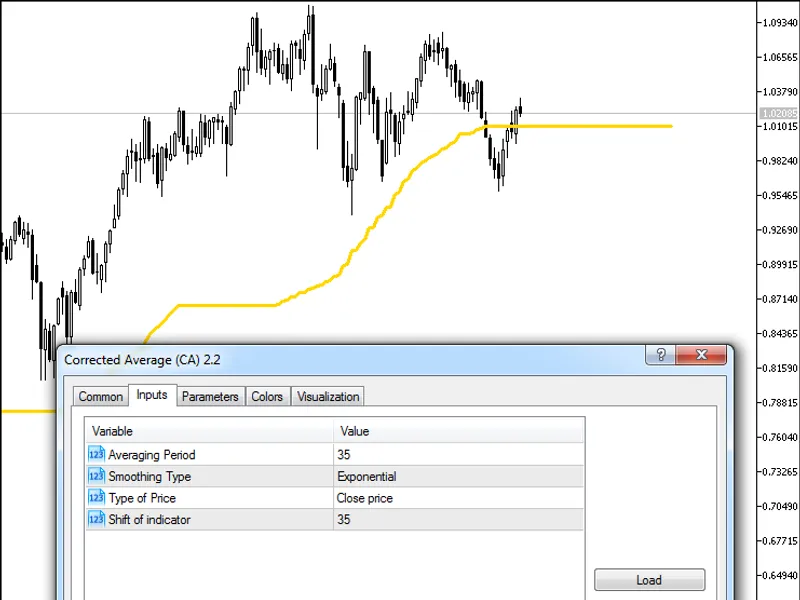
The Corrected Average (CA) indicator, also known as the "optimal moving average", is a powerful tool for traders. Its key advantage lies in its ability to adapt to market condition...
This indicator is designed for use with constant range charts, such as Range Bars or Renko Boxes, rather than standard candle or bar charts.Constant range candles/bars have the sam...
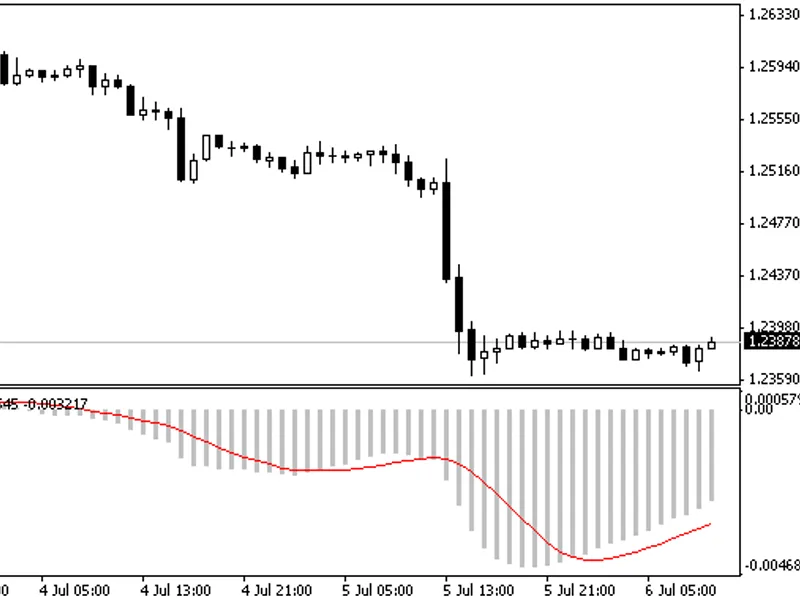
The standard MACD indicator is calculated using specific formulas: the main line (MACD) is derived from the exponential moving average (EMA), while the signal line (signal) is base...
This indicator computes the median of an odd span. The median is described as the numerical value separating the higher half of a sample, or a probability distribution, from the lo...
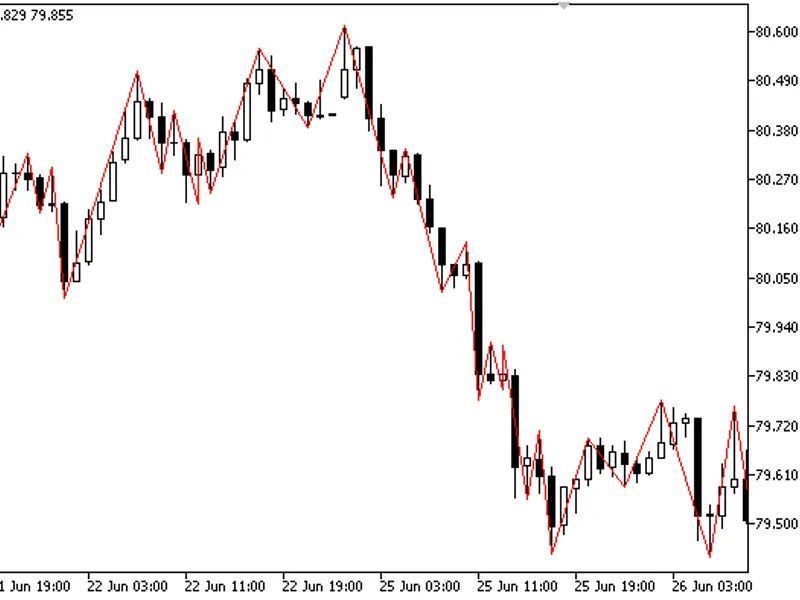
This is a fast and efficient Zig Zag indicator with optimized peak retrieval.Advantages:- The indicator replaces all cycles for peak retrieval with arraybsearch, making it faster t...
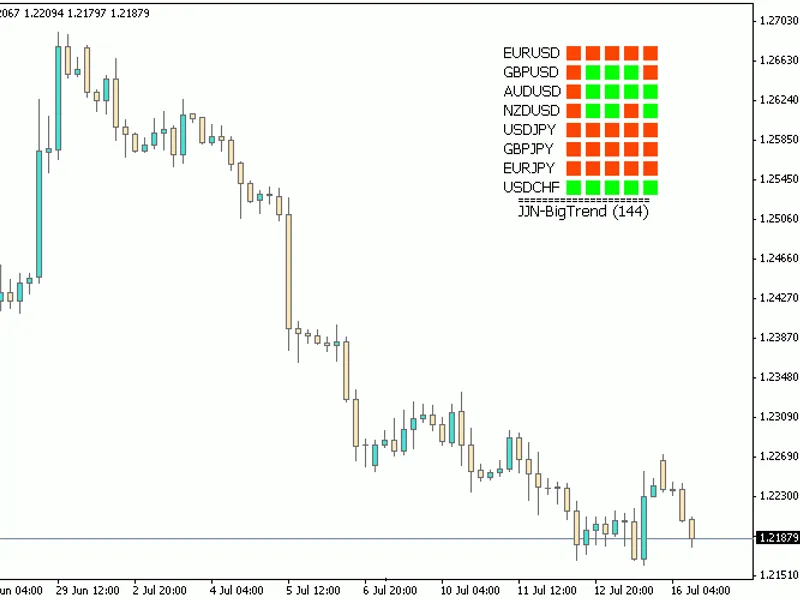
A versatile multicurrency trend indicator designed for flexibility and customization.This indicator allows you to adapt it to your preferred timeframes and currency pairs.To custom...
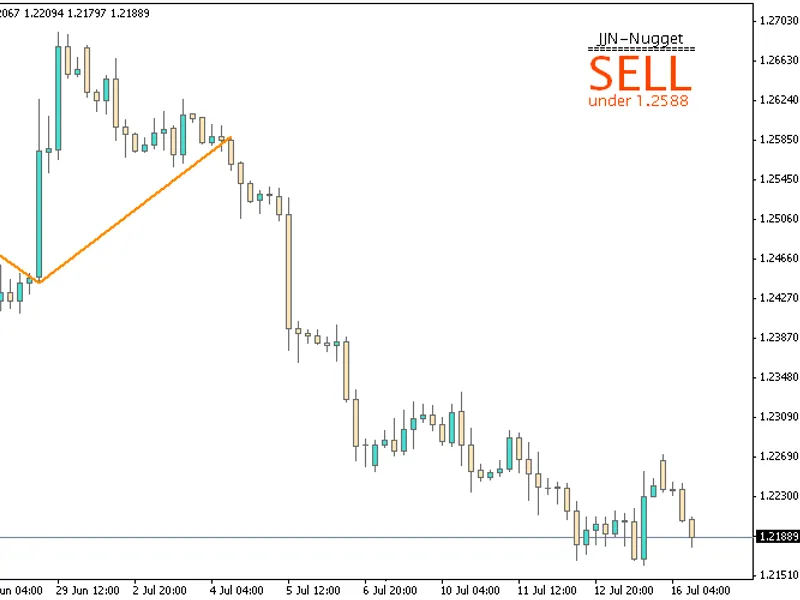
This indicator provides buy or sell signals and entry levels. It is recommended for use on M5 or higher timeframes.Important:- Do not open a new trade immediately when the status (...
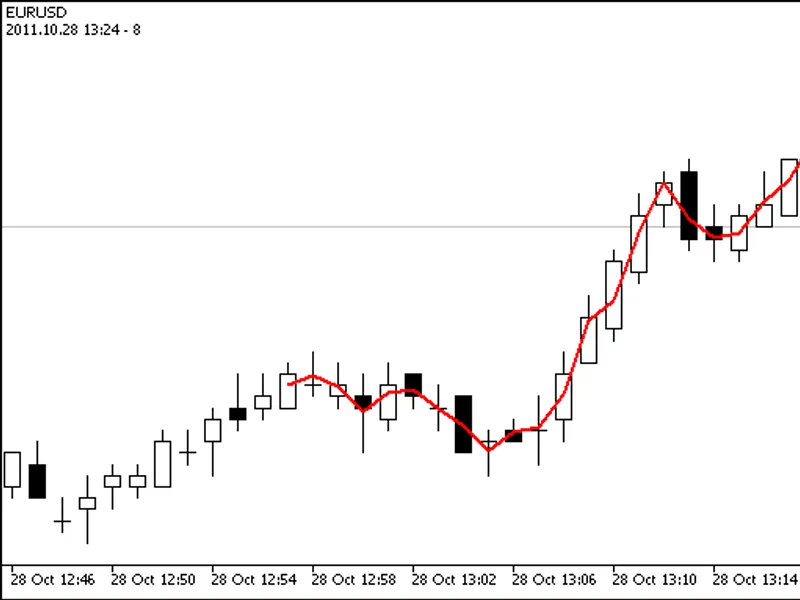
This indicator calculates the last average price for a symbol and determines the trend direction, providing a signal for potential trade operations.Recommended Timeframe: M1.The We...
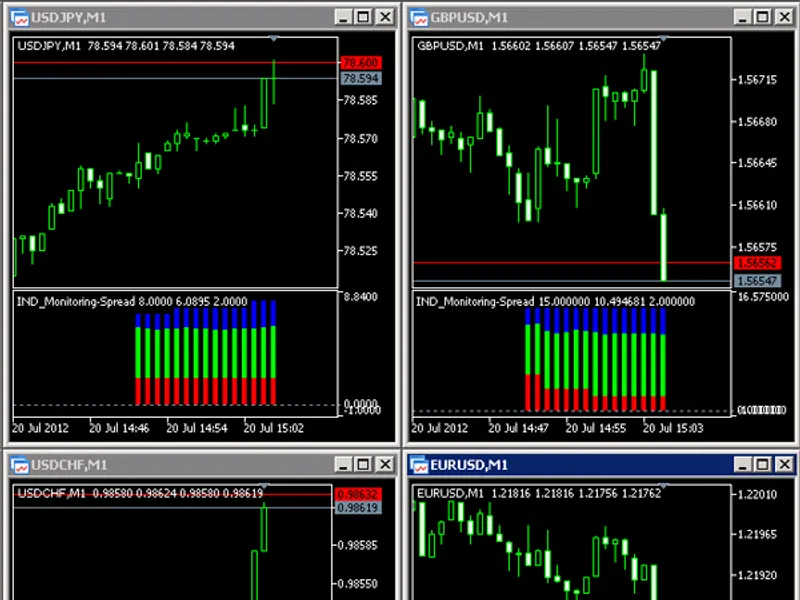
This indicator provides a visual representation of the spread dynamics on your charts.It displays the minimum (red), average (green), and maximum (blue) spread values as a histogra...
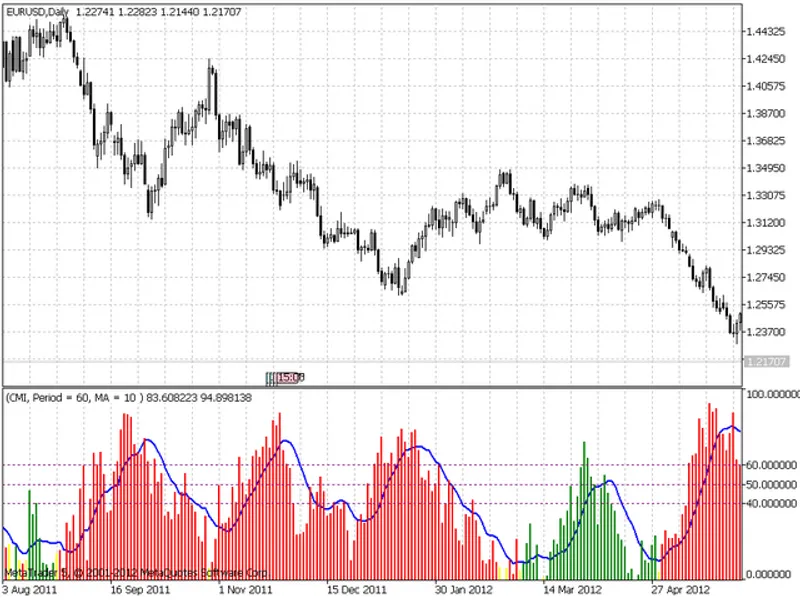
The Choppy Market Index (CMI) is a versatile indicator designed to assess market stability and trend probability. The indicator values range from 0 to 100, where higher values indi...
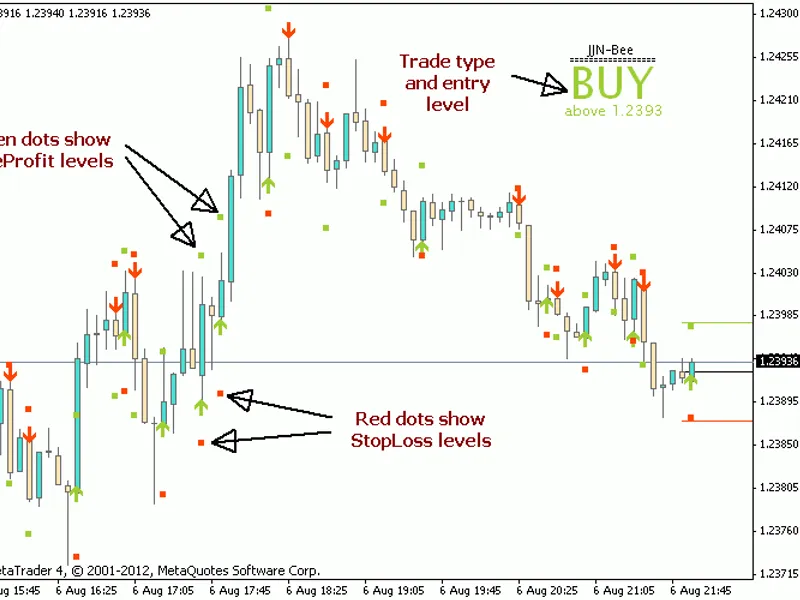
jj n-bee is a scalper system that displays entry, take-profit, and stop-loss levels. It is designed for use on M5 charts or higher timeframes.The take-profit and stop-loss levels a...
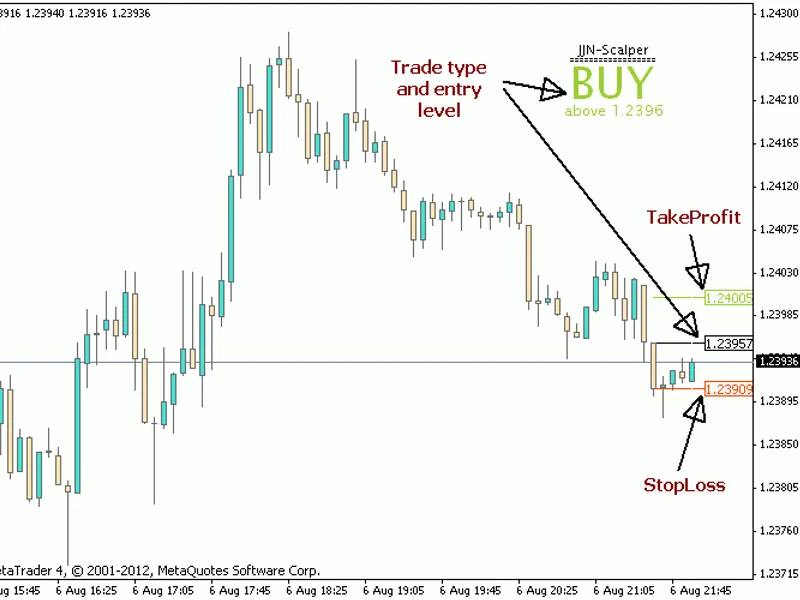
Scalper system that displays entry, take-profit, and stop-loss levels. Designed for use on M5 or higher timeframes.Take-profit and stop-loss values are derived from the ATR indicat...
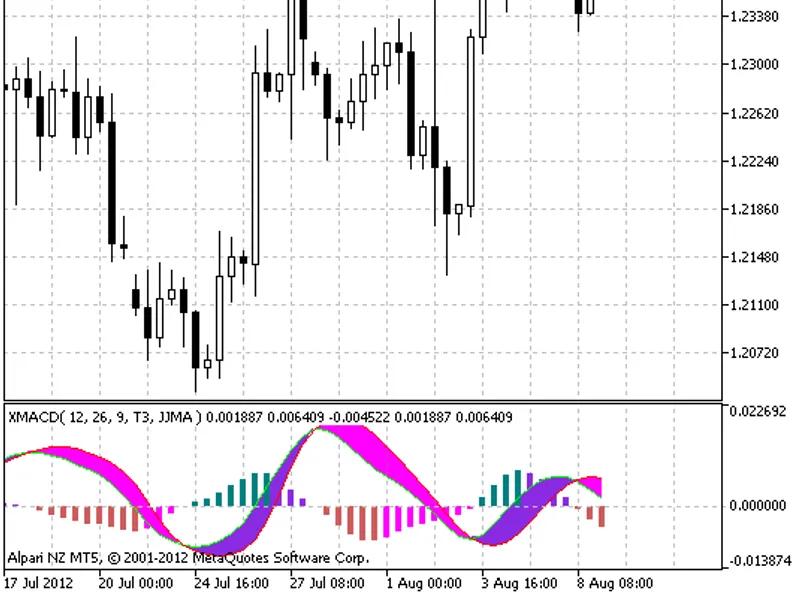
Two-line MACD.This indicator is available by default in a great deal of trading platforms, but it cannot be found in MetaTrader 5.The indicator was first implemented in MQL4 and pu...
Pentuple Exponential Moving Average is a technical indicator that combines multiple exponential moving averages to provide a more accurate and responsive trend signal.Introduction ...
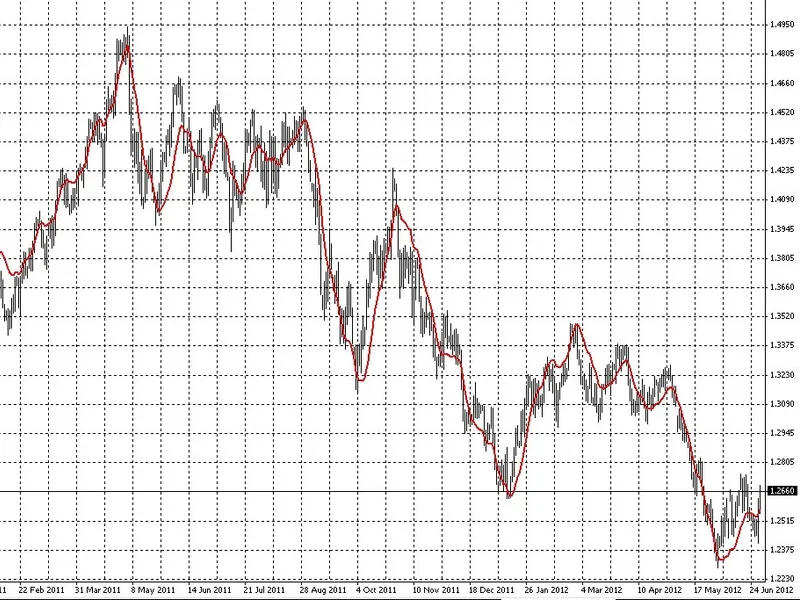
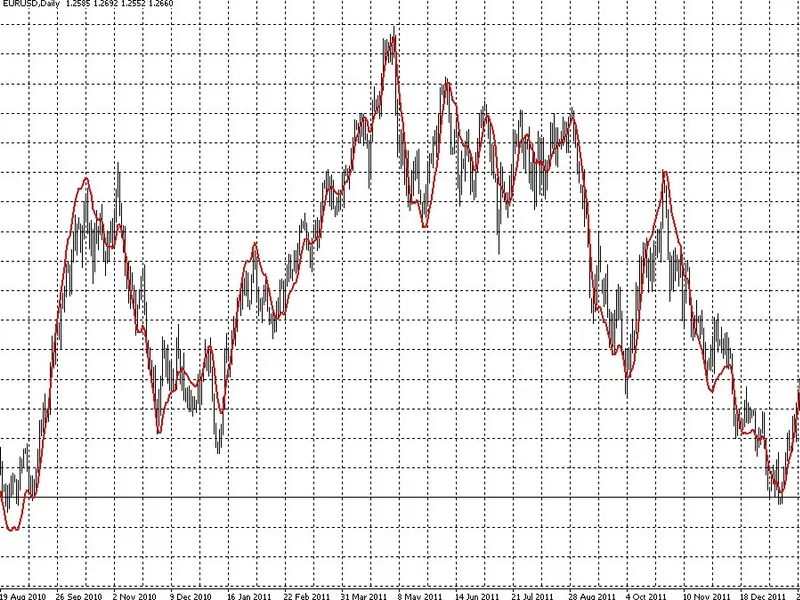
QEMA - Quadruple Exponential Moving Average.QEMA is calculated as: QEMA = TEMA + DEMA(Y - TEMA).QEMA is set to 50, and the EURUSD D1 modification is based on the original TEMA to c...
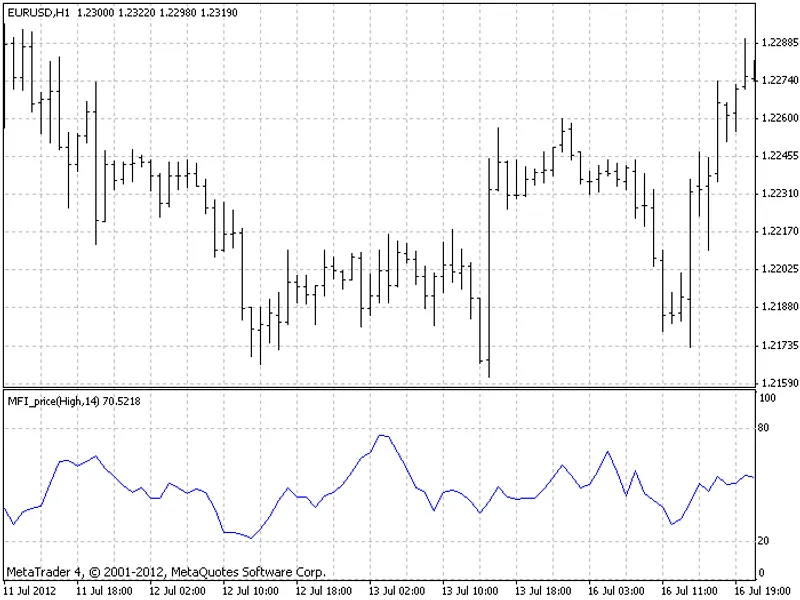
Indicator Money Flow Index (MFI) uses typical price for its creation. This version allows you to select all types of price.Input Parameters:- Applied Price:0 – Close Price1 – Open ...