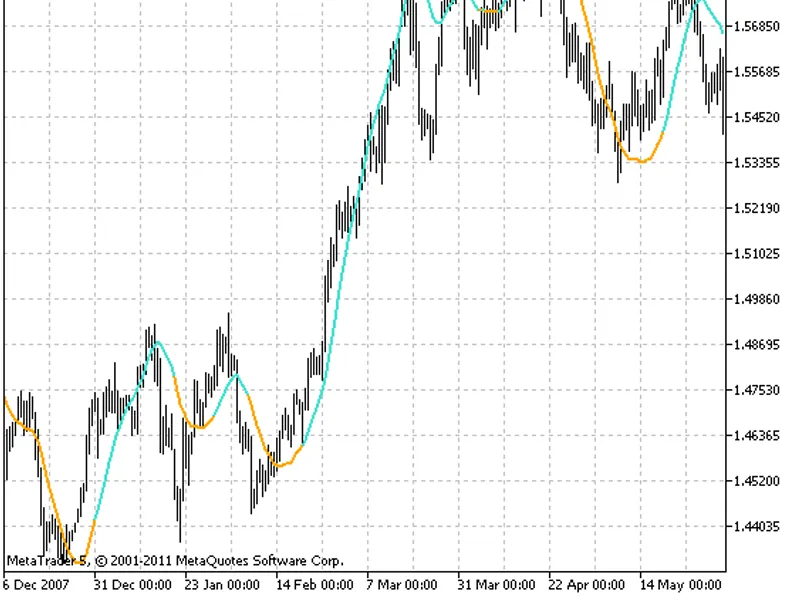
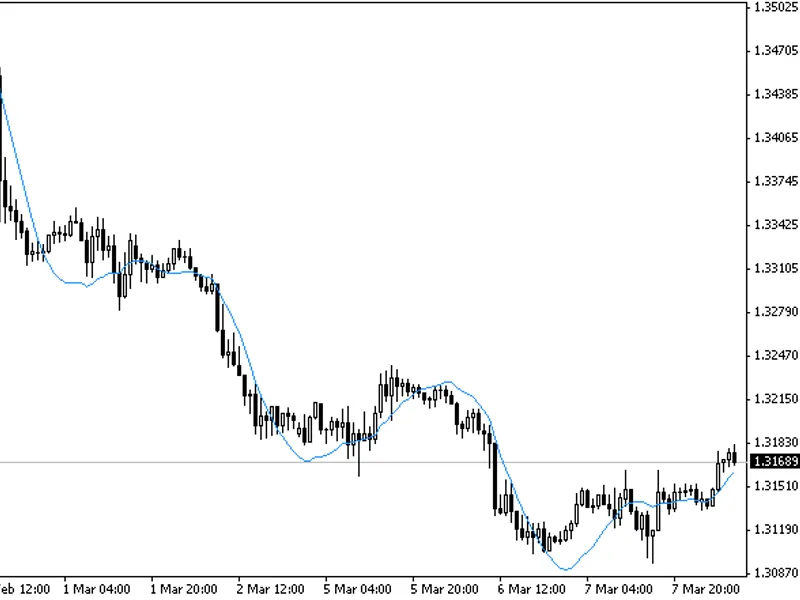
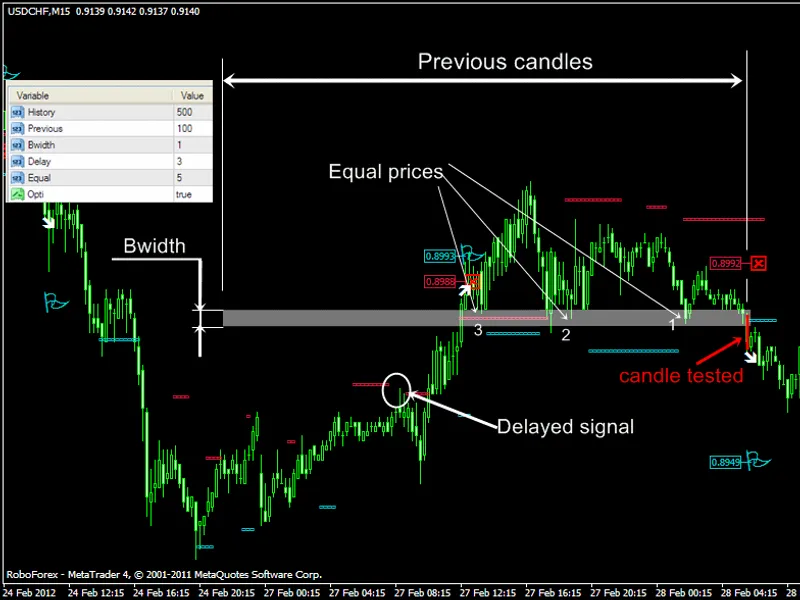
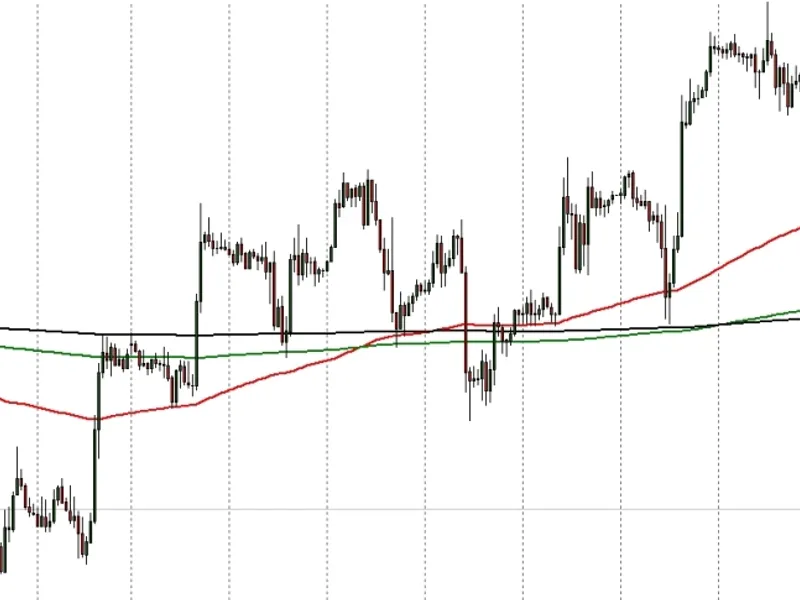
The Kalman Filter indicator displays a fast adaptive line, enabling traders to assess a trend line. This indicator was initially introduced in MQL4 and released on 14.09.2022....
This typical signal indicator is based on and technical indicators. Since the indicator generates many false signals, it's necessary to filter them with some trend indicator.This i...
This indicator displays the 'ultimate support/resistance' levels of the current trend. Trend changes are indicated by color rectangles, while trend direction is shown with colored ...
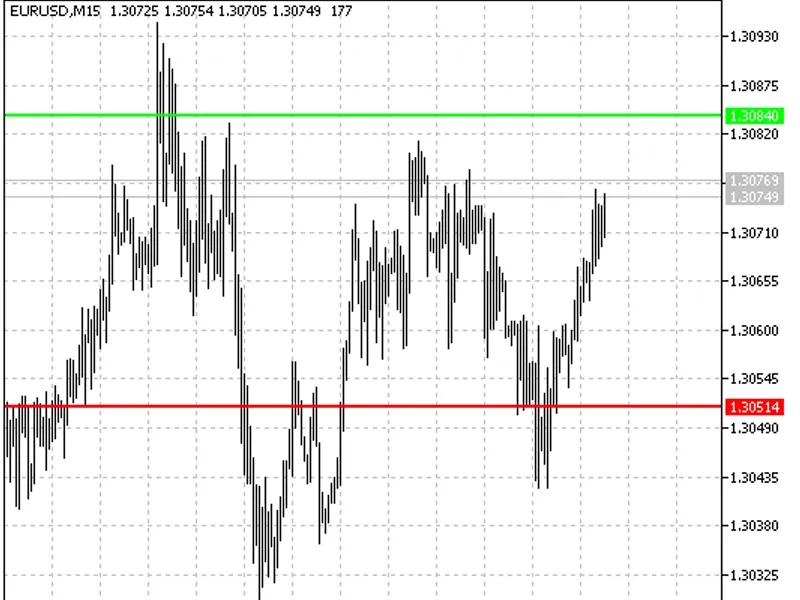
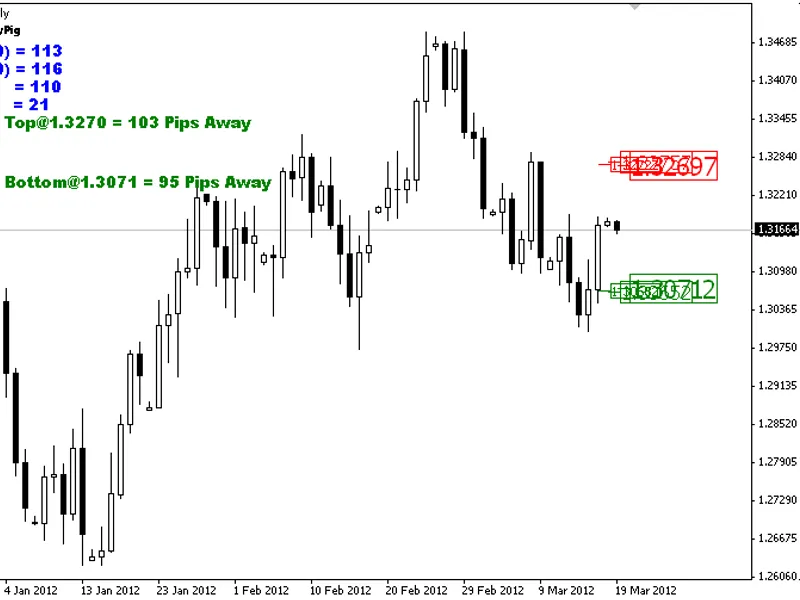
The Daily Range indicator calculates forecast prices for the daily price range, displaying resistance and support levels for the current day based on the previous day's prices. The...
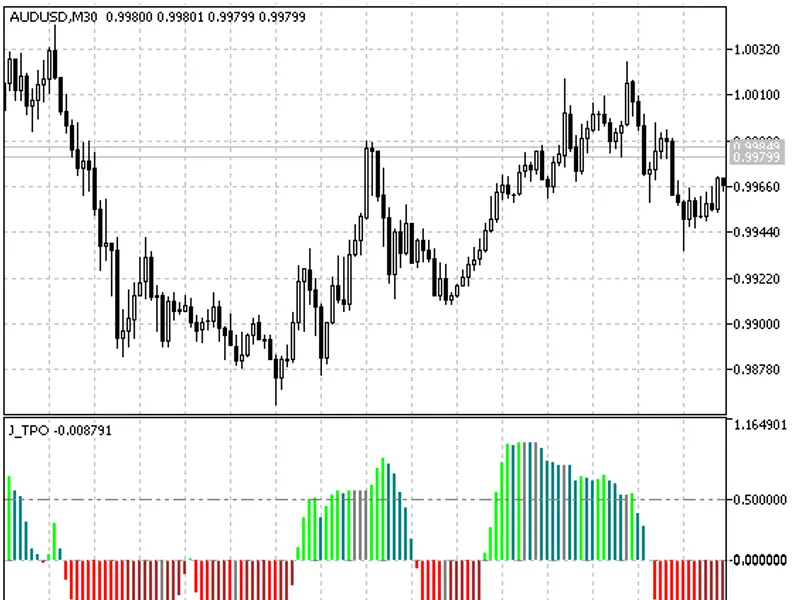
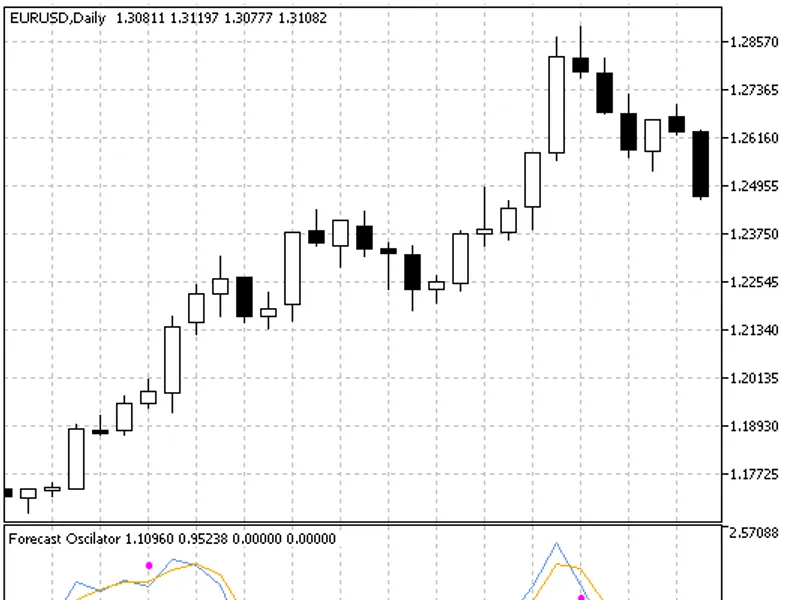
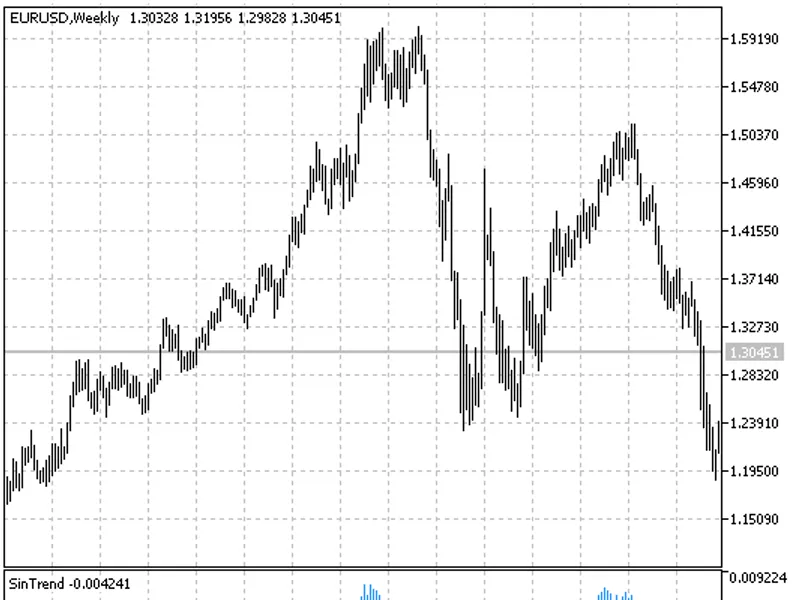
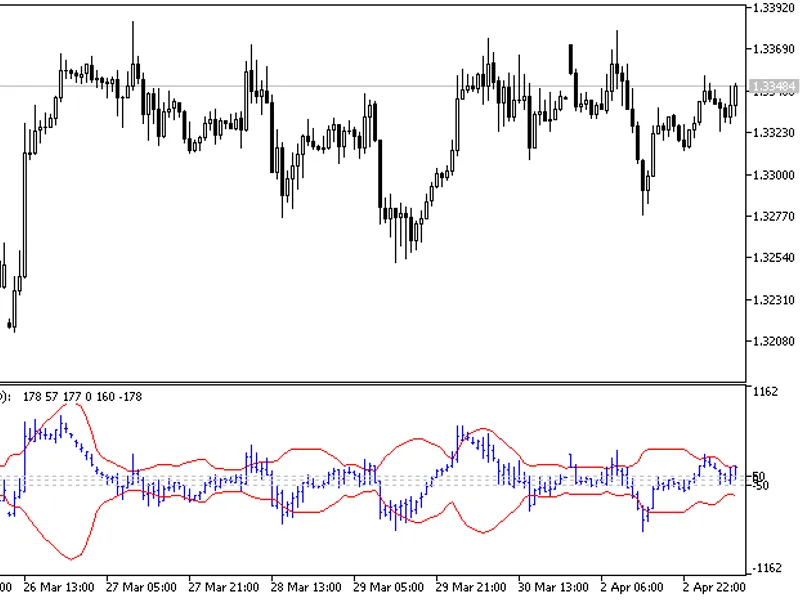
A normalized oscillator displayed as a histogram.The output signal ranges from -1 to +1, resembling the indicator. Trend reversal signals typically occur at the -0.5 and +0.5 level...
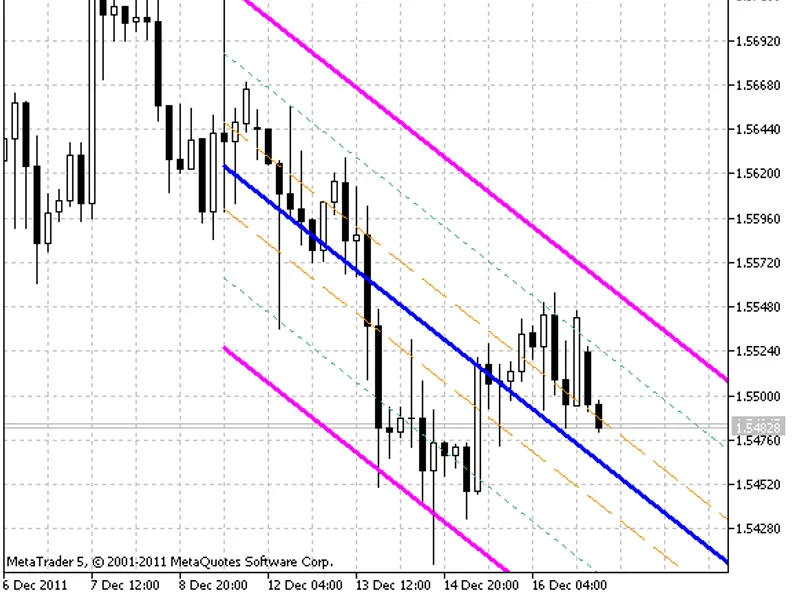
The Linear Regression indicator is a powerful tool for analyzing financial markets, helping traders identify moments of extreme price deviation from a 'standard' level.This indicat...
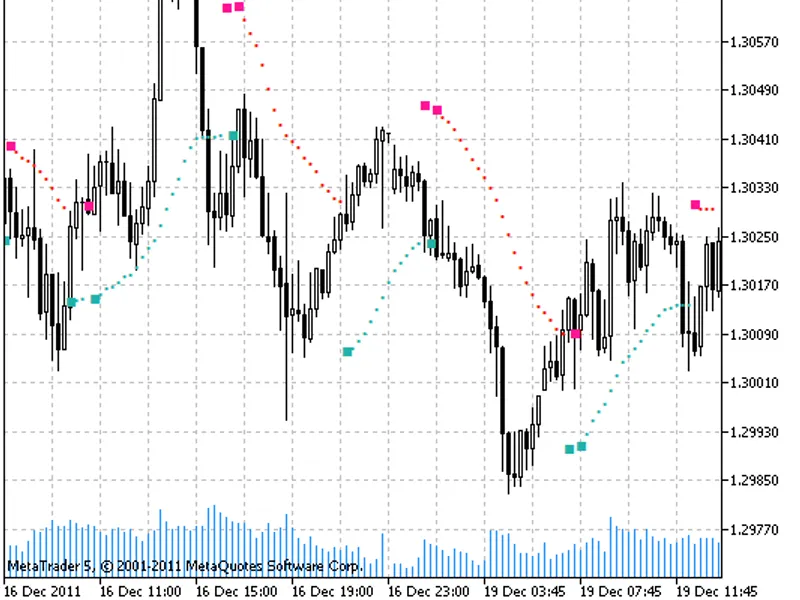
Signal indicator for the popular trading system with advanced price timeseries smoothing.Traders often encounter challenges with standard braintrendsig1 (bts1) due to its propensit...
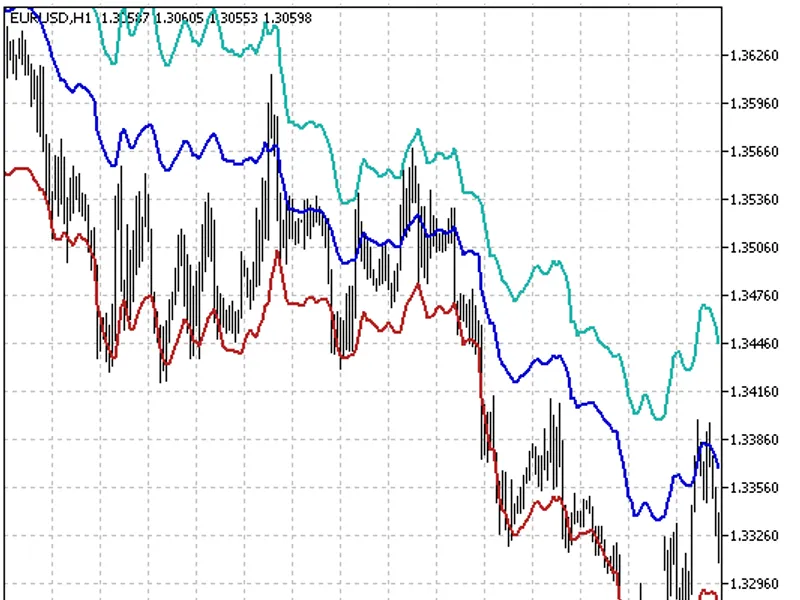
This indicator employs a sophisticated three-channel strategy for technical analysis, offering a comprehensive view of market trends and potential price movements.The indicator's c...
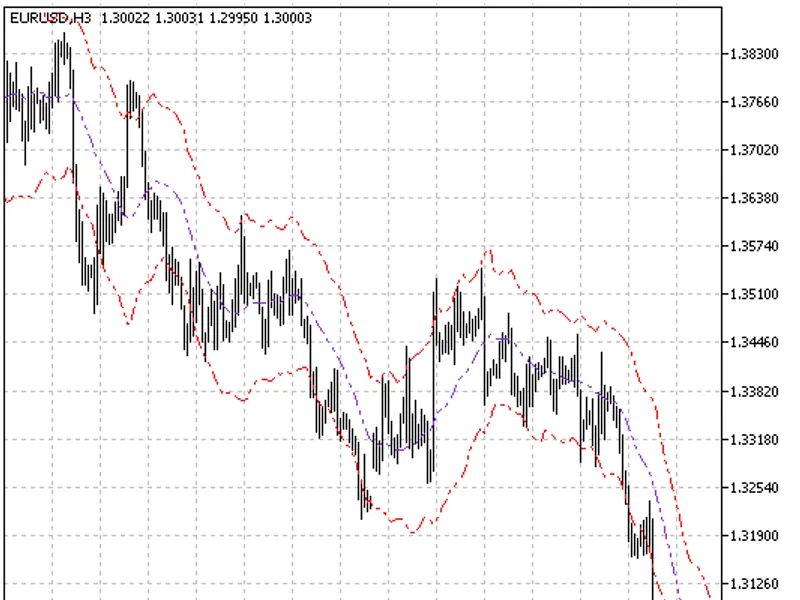
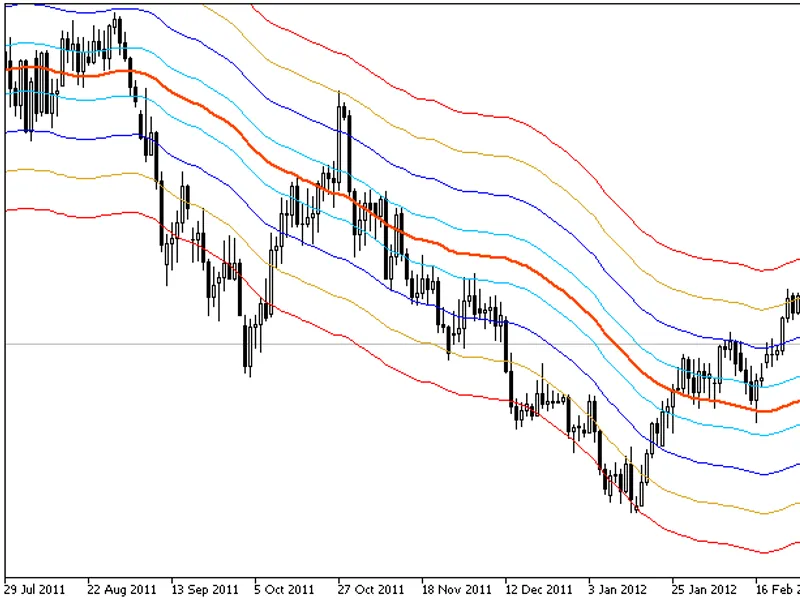
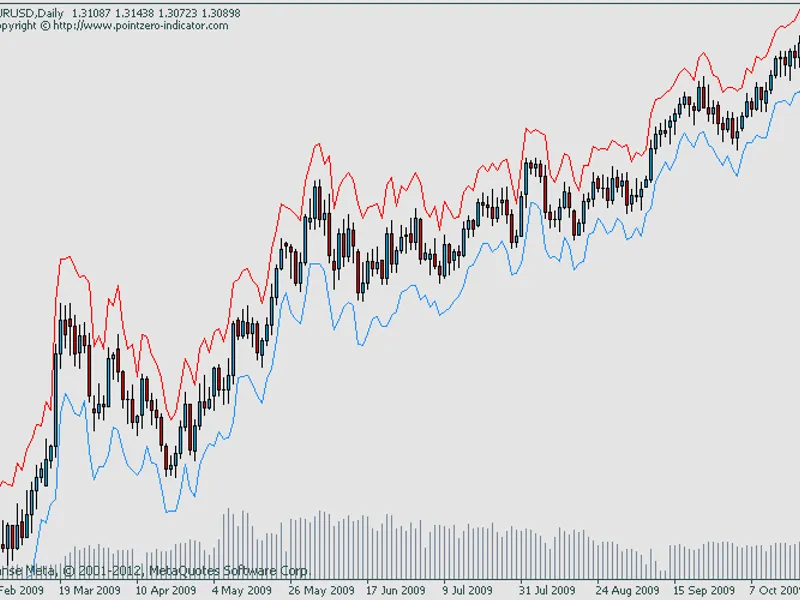
The channel based on the Average True Range (ATR) technical indicator deviations from the moving average.This indicator was first implemented in MQL4 and published in 2026....
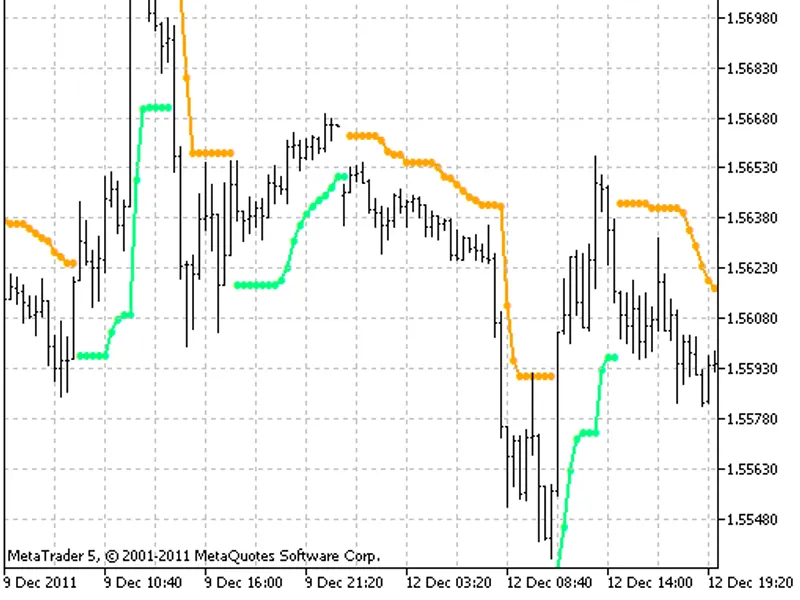
The Jbrain Trend1 Stop indicator is designed to build stop-loss levels based on the BrainTrend1 trading system, incorporating preliminary price time series smoothing.The standard B...
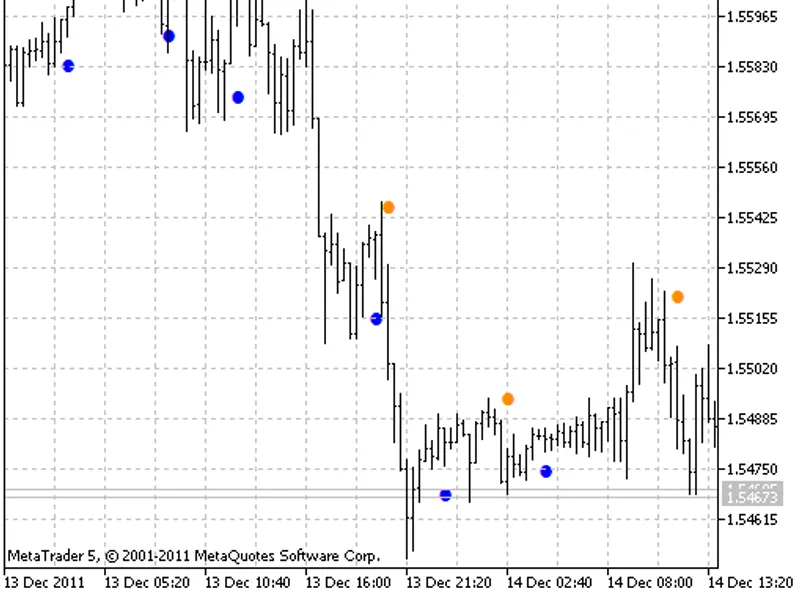
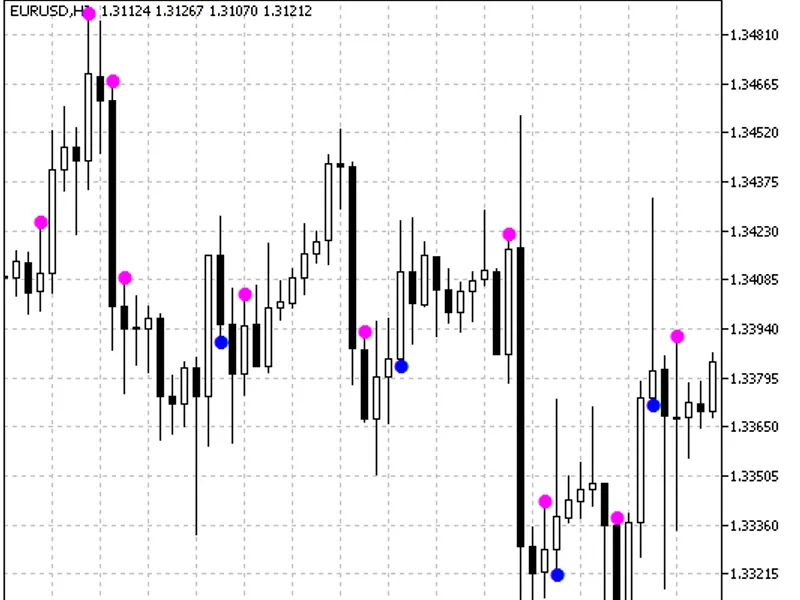
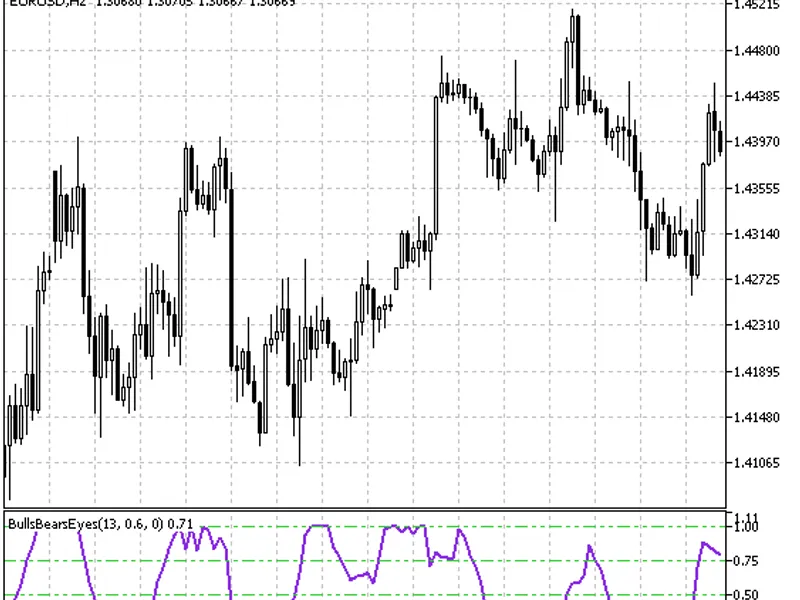
Normalized oscillator with a signal line and colored dots for trade signals.This indicator was originally developed for MQL4 and released on 24.09.2026....
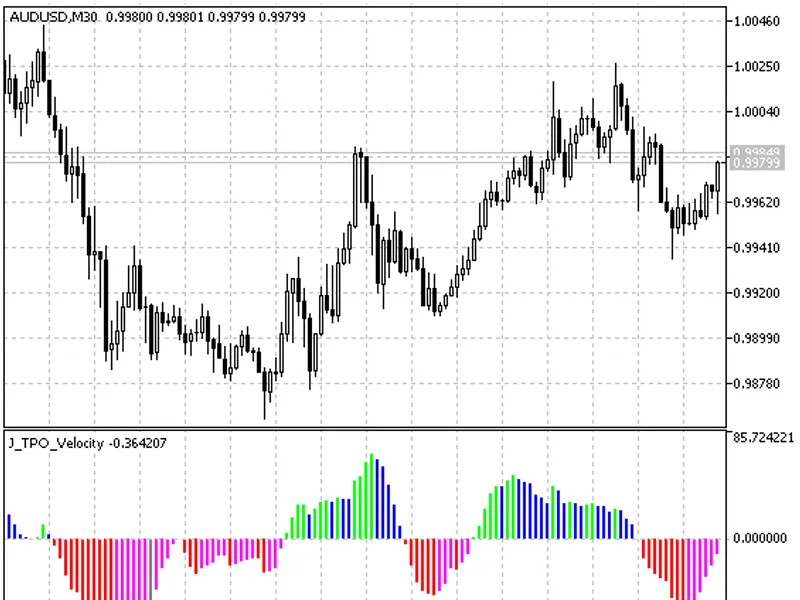
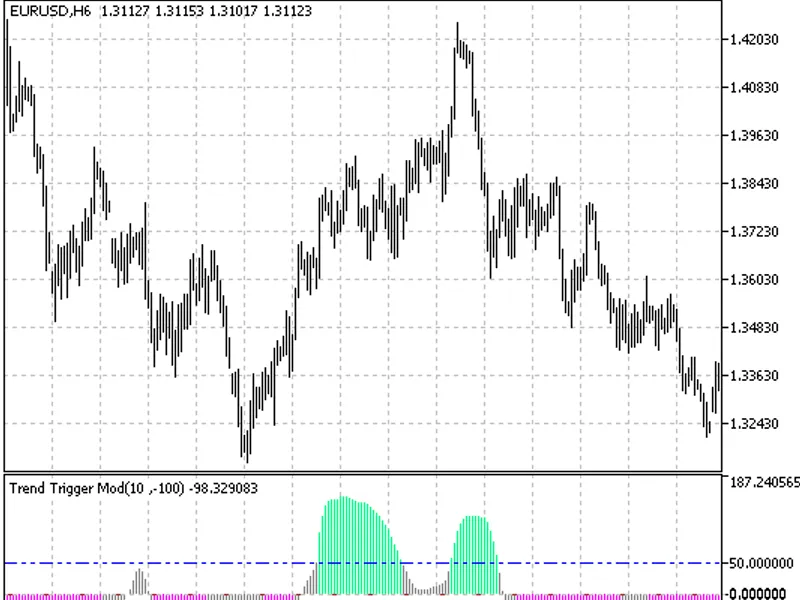
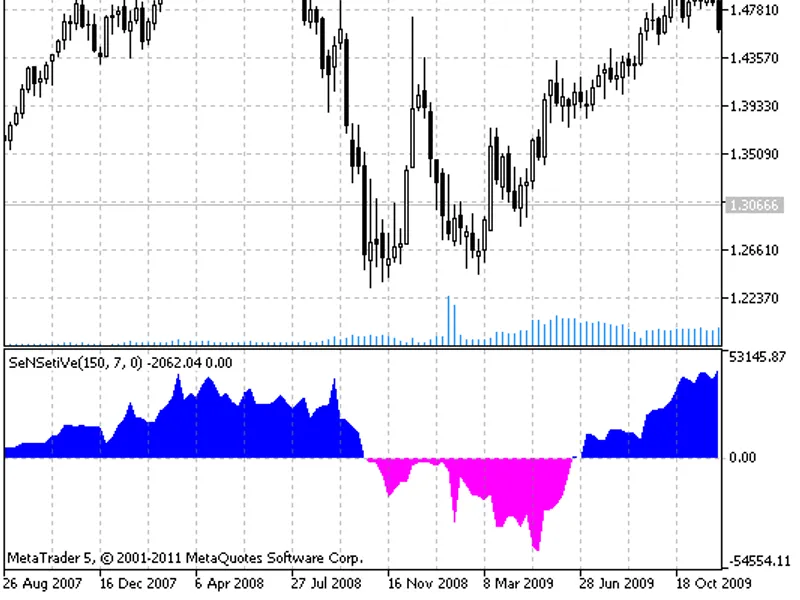
The indicator displays trend power and direction. If the histogram values are within breakout levels specified by the input parameters, the histogram is gray. Otherwise, the histog...
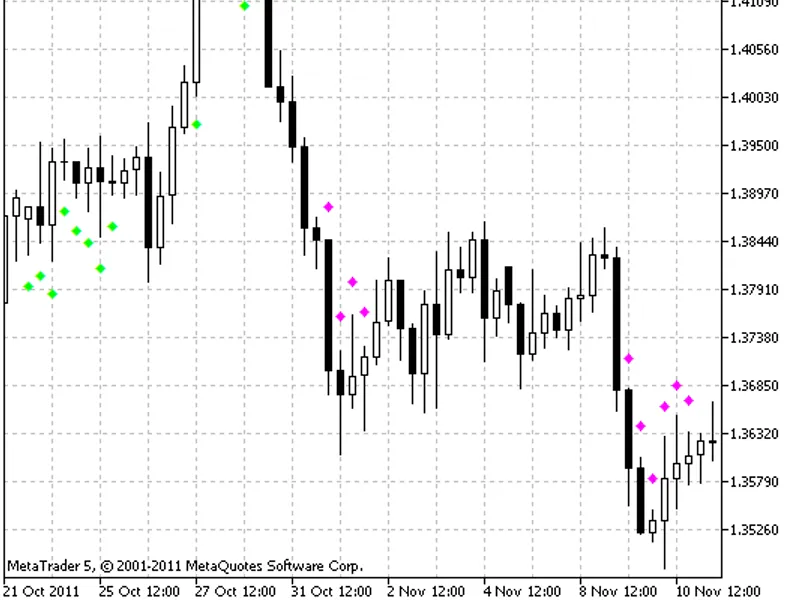
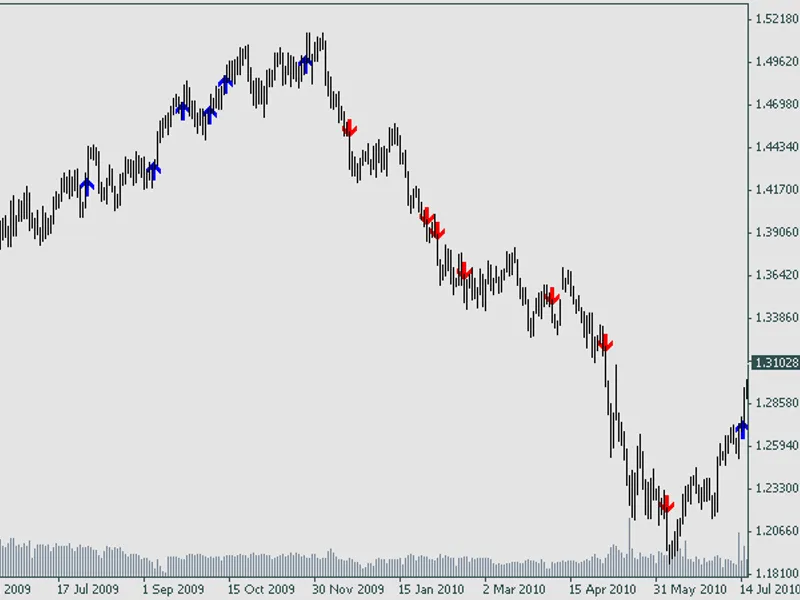
The FX10 semaphore signal indicator is based on the values of five technical indicators.Indicator OverviewThe indicator was first implemented in MQL4 and published in 01.11.2026.Th...
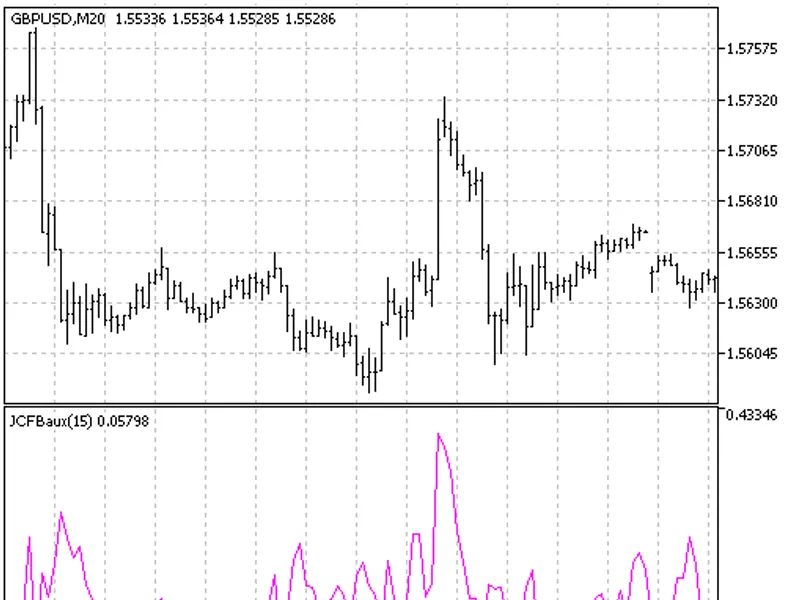
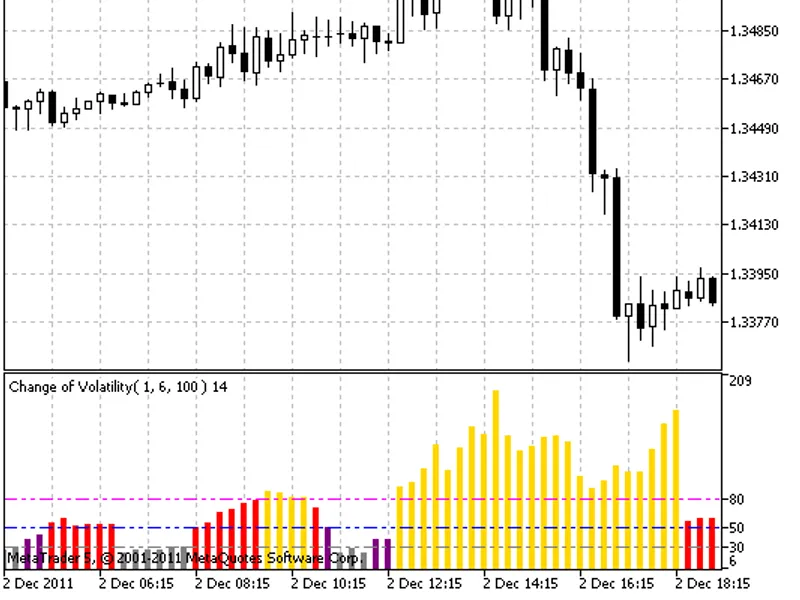
This indicator measures the correlation between short-term and long-term volatility, providing insights into market behavior.Volatility, the changeability of prices, can be measure...
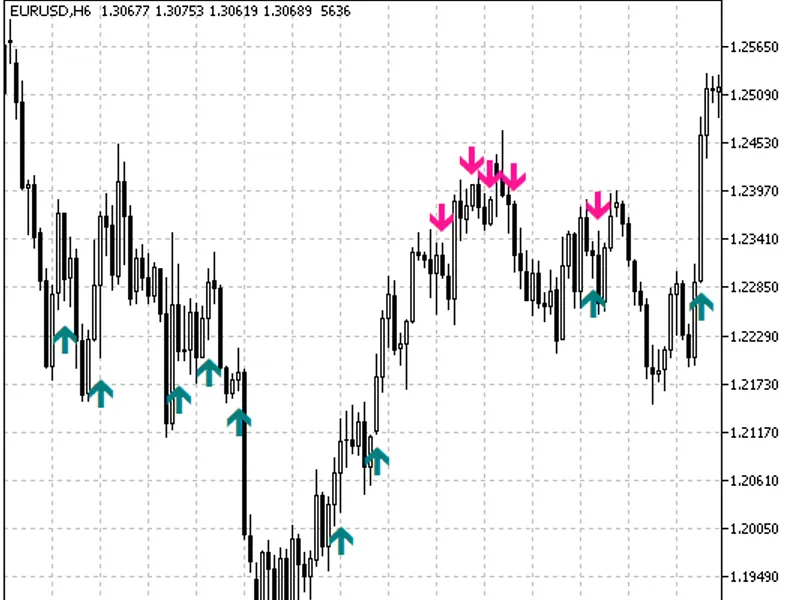
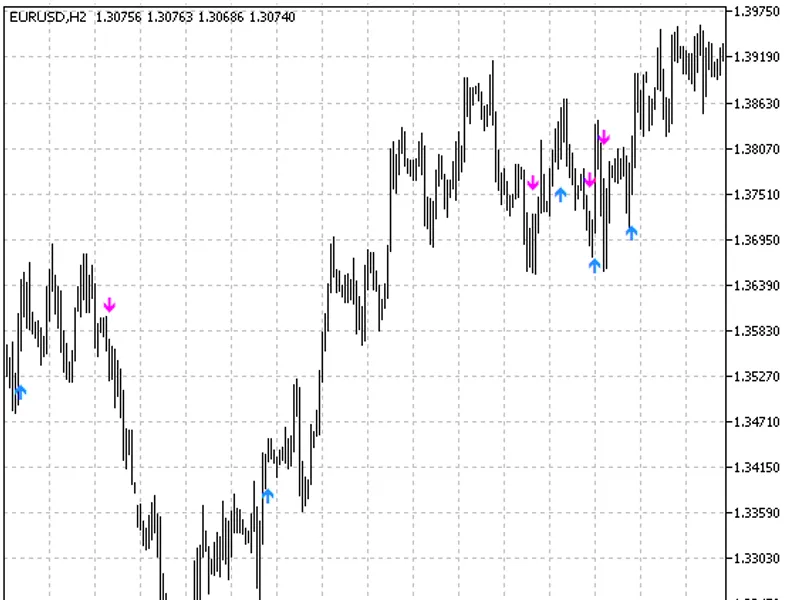
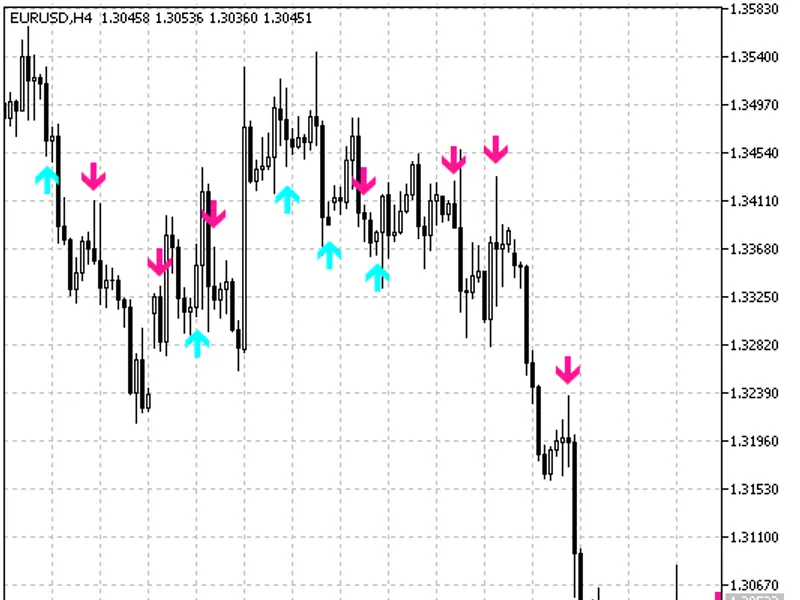
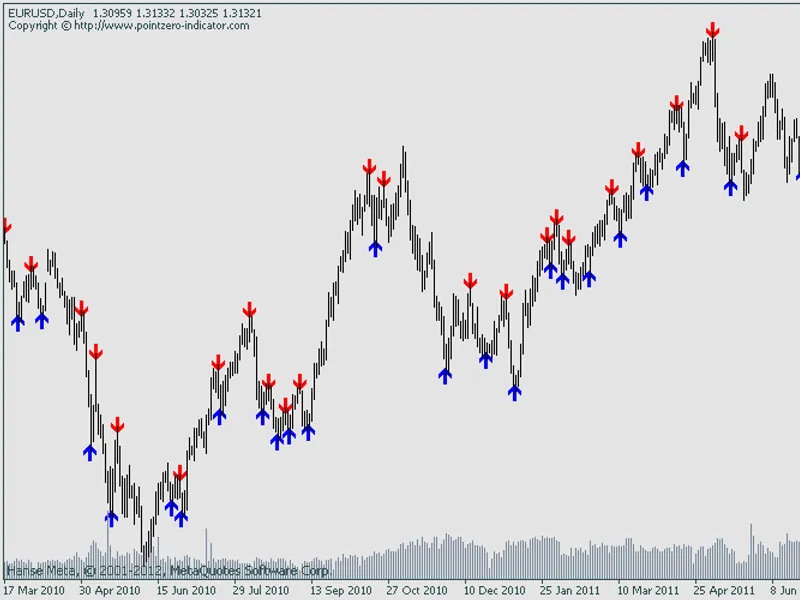
Typical semaphore signal indicator that shows market entry points using color arrows.This indicator was first implemented in MQL4 and published in 2026....
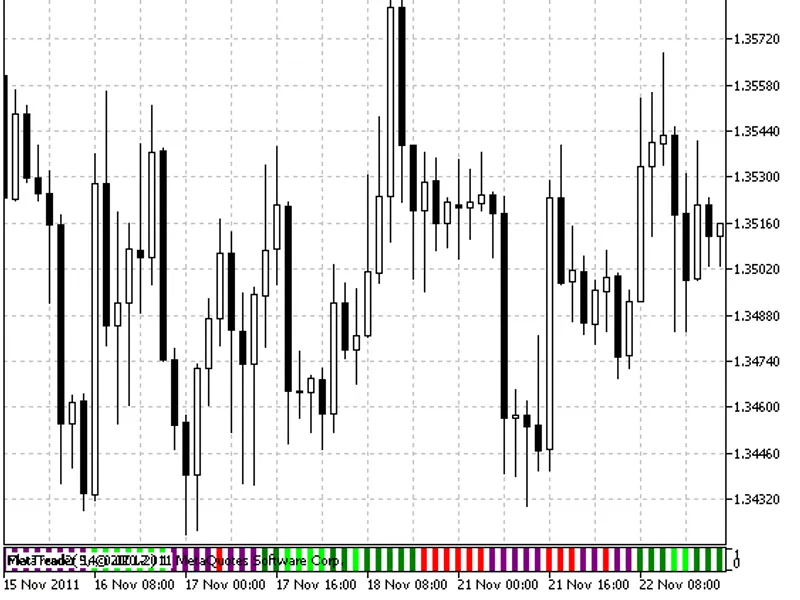
A straightforward signal indicator designed to identify trend strength and direction. Strong trends are indicated by lime and red colors, while weak trends are represented by green...
Lizhniyk eThis indicator is an alternative to the with reduced delay and adjustable sensitivity ratio.It was initially implemented in MQL4 and released in the code base on 28.02.20...
WellxThis indicator provides signals for market entry based on the principles outlined in B. Williams' book.The initial implementation of this indicator was in MQL4, released on 02...
A simple trend indicator designed to provide clear entry signals based on the histogram's position relative to the zero level.The indicator offers a straightforward trading strateg...
The indicator values are calculated as the sum of and technical indicators values averaged using the Laguerre algorithm.This indicator was implemented in MQL4 and published in 2026...
The FP Channel indicator is a technical analysis tool that identifies price channels based on extreme values over a specified period. It calculates the central line and upper and l...
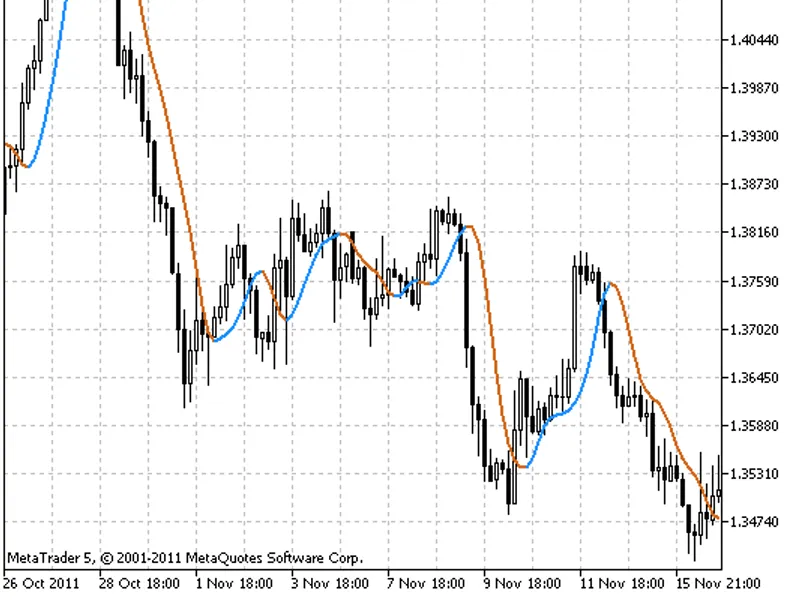
The trend indicator that provides signals for executing trades. The indicator color is determined by the market's movement direction, which is calculated based on the indicator's p...
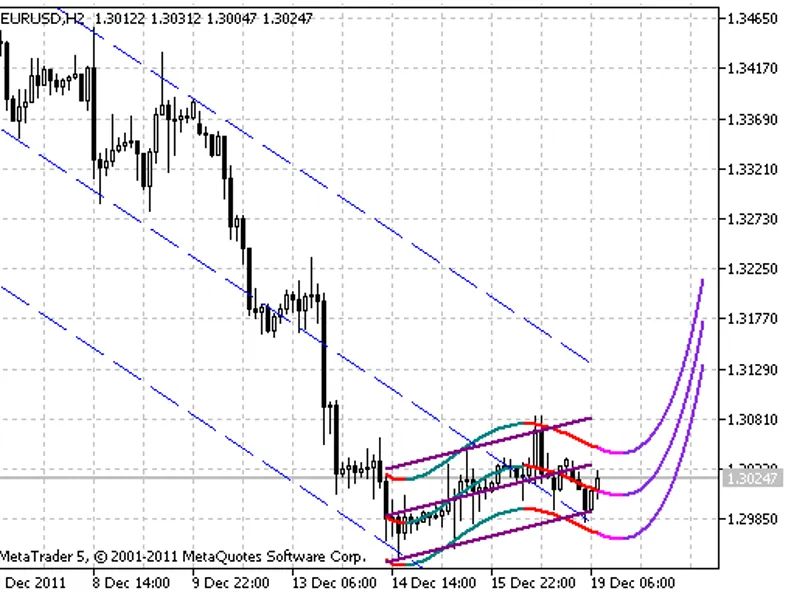
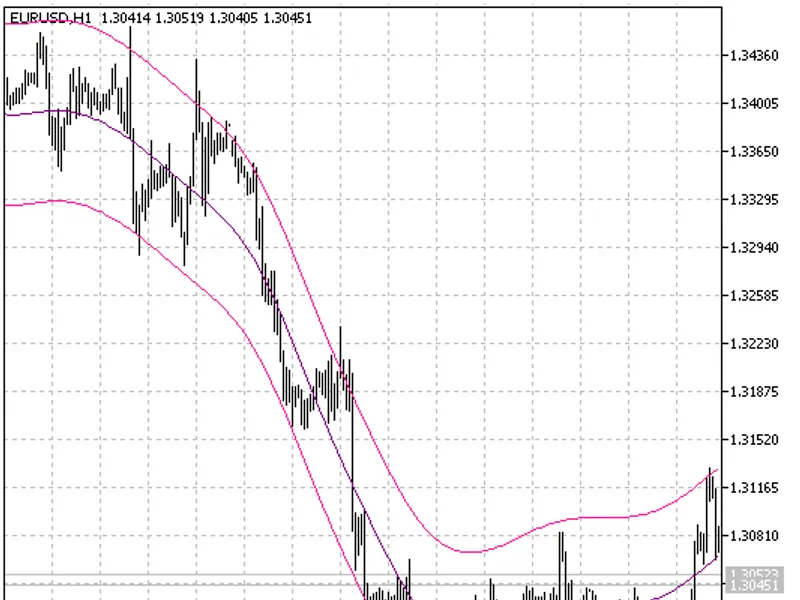
This indicator constructs a curvelinear redrawing channel for each point in time. Consequently, observing its historical behaviour is not meaningful, as the channel's appearance si...
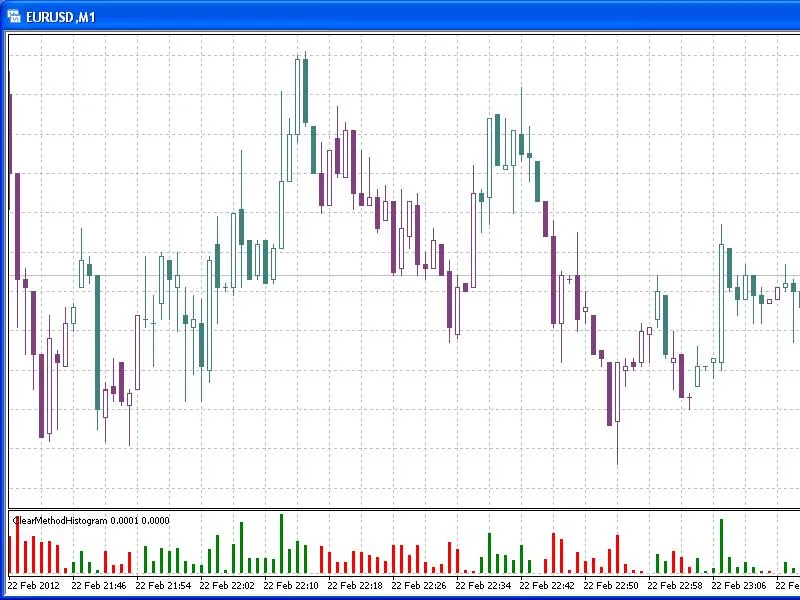
This indicator is based on the article: 'Getting Clear with Short-Term Swings' (2026).To set up colored candle charts:1. Switch to a line chart.2. In the chart properties window, s...
This indicator provides visual and verbal buy/sell signals based on Bill Williams' Trading in the Zone methodology, incorporating the Alligator and MACD indicators.Bill Williams' T...
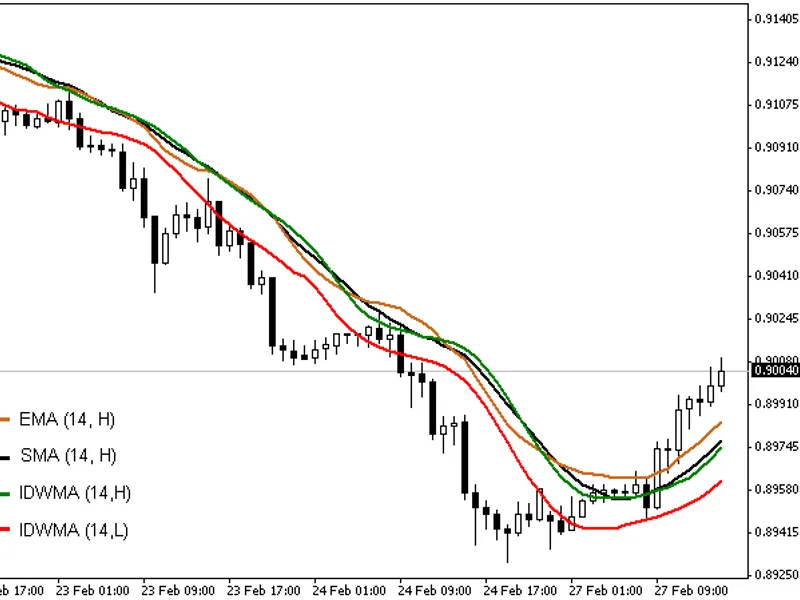
This multi-timeframe capable moving average applies less weight to prices that are further from the average. It offers a smoother curve compared to SMA while closely tracking price...
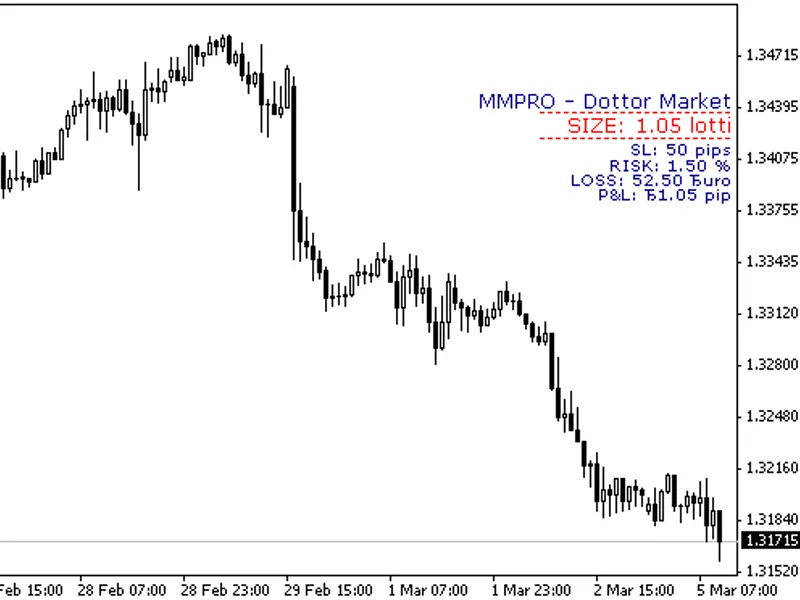
The indicator displays the lot size corresponding to the specified risk.Functionality:Upon application to a chart, you must configure two fundamental parameters:- The stop you inte...
This indicator implements innovative techniques for efficient data processing.It employs two key methods:- Moving totals- SimplificationThese methods enable rapid calculation of va...
The Triniti indicator is a powerful tool for traders using MetaTrader 4 and 5. It offers a unique approach to identifying support and resistance levels, providing valuable insights...
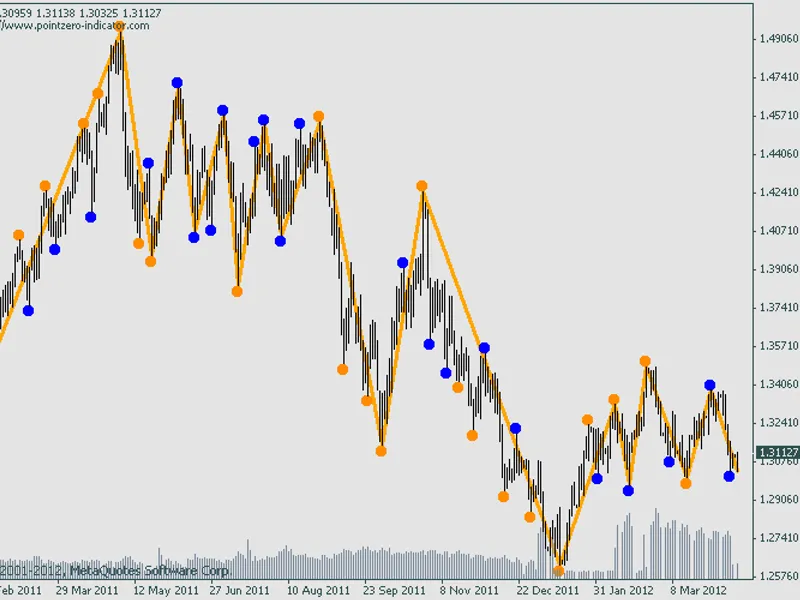
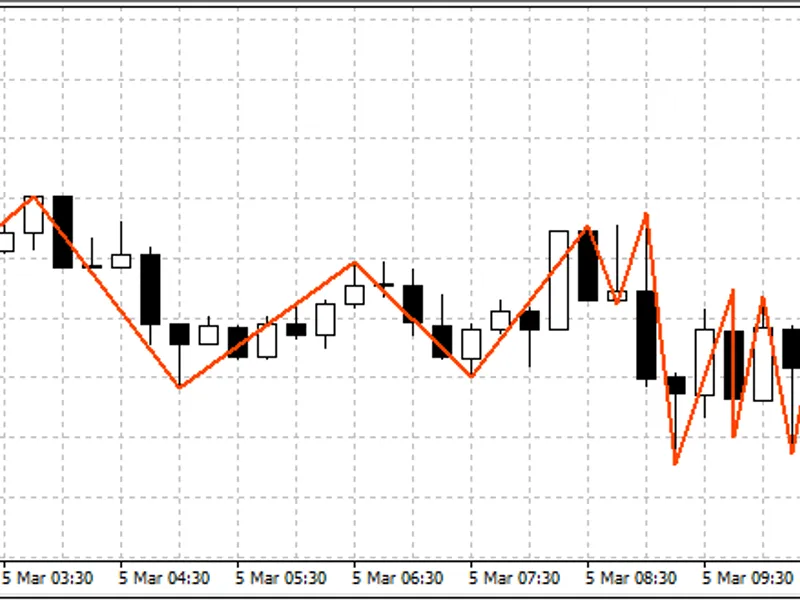
This indicator is a simple tool that displays signals generated by two zigzag indicators, fast and slow, without any additional filtering. It is designed to never repaint past sign...
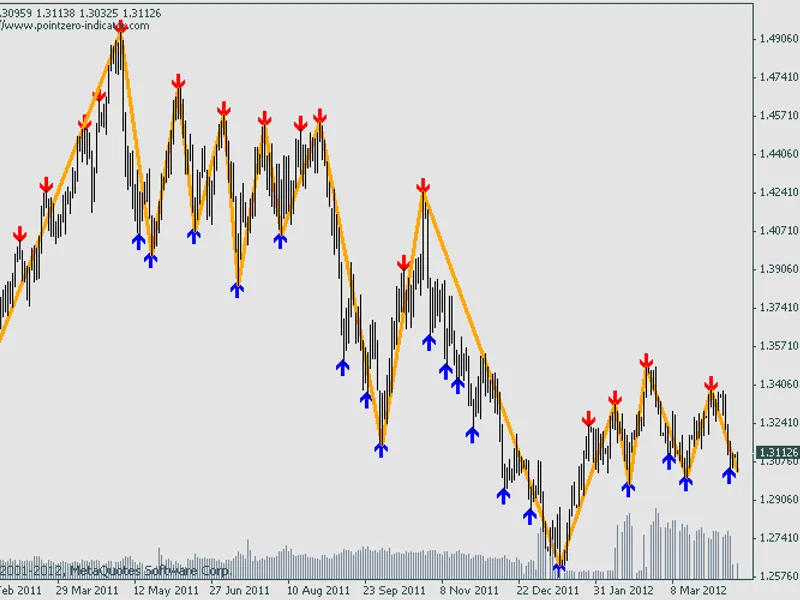
This indicator combines fractal signals with the original Zigzag indicator, providing a unique trading tool.Key features:- No signal repainting: Signals are stable and reliable, al...
This indicator calculates the average daily range for 5, 10, and 20 days.It provides an on-chart display in the top-left corner, showing the day's price movement in pips with color...
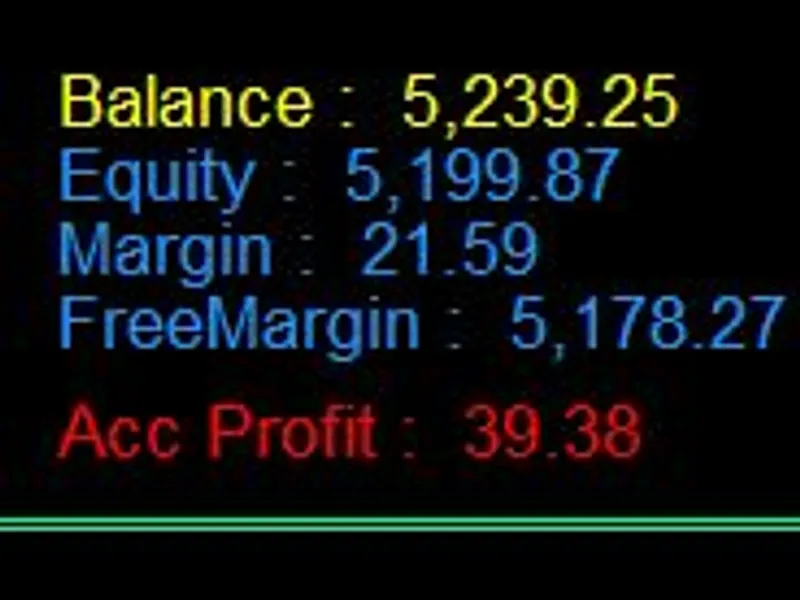
Description:This indicator displays essential account information, including balance, equity, margin, free margin, and profit. It offers flexibility in positioning and customizatio...
This indicator provides a comprehensive trading strategy based on moving averages.The blue line represents an optimistic entry point, indicating a potential trend change.The yellow...
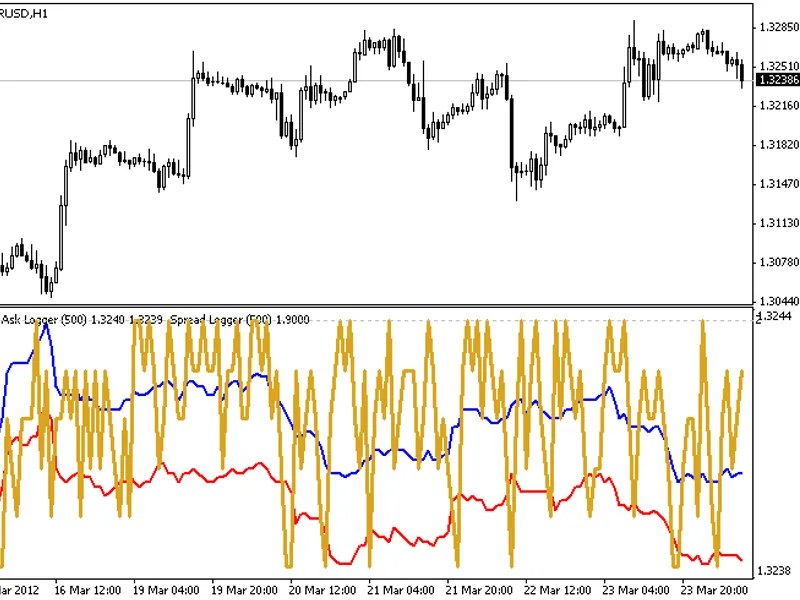
It's time to introduce my contribution to the MQL4 community, addressing a common concern: Are brokers honest about the spreads they offer?I've developed two lightweight indicators...
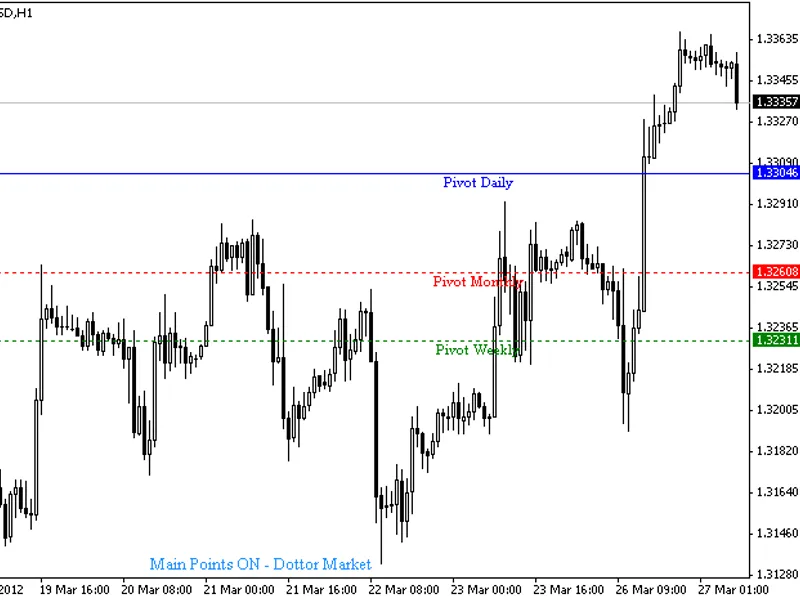
DailyWeeklyMonthlyThe first (daily) is updated every day, while the second and third are updated at the end of the weekly and monthly candles. You can customize the line and text c...
This indicator offers a unique approach to Zig Zag analysis with several advantages:- The ibarshift function optimizes performance by replacing all cycles in the code for peak retr...
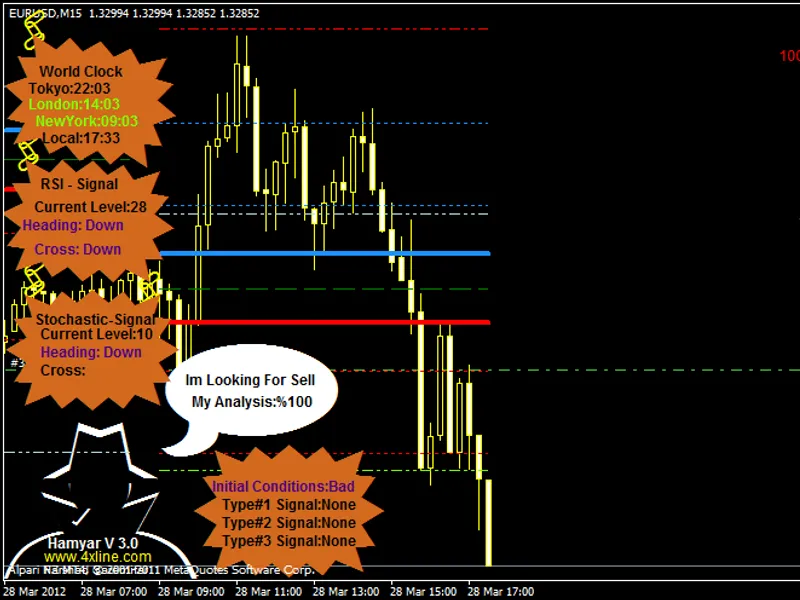
Remember to install the fonts.The indicator is based on pivots in different situations and is best used on the 15-minute time frame. Attach the HamyarZone indicator to the chart be...
This indicator provides a unique visualization of price action relative to a moving average within a separate window.It creates a distinctive pulse-like representation, offering a ...
This indicator analyzes 5-bar and 7-bar fractals to identify potential price reversals.Key Features:- Highlights significant fractals for easy identification.- Designed to assist i...
This indicator displays spread-related values, providing essential information for traders using the MetaTrader platform.Key features include:- Spread- Bid + Spread- Ask + Spread- ...
This indicator provides a comprehensive tool for traders, offering an ATR envelope that encapsulates price action, enabling precise stop-loss and take-profit level determination.Ke...
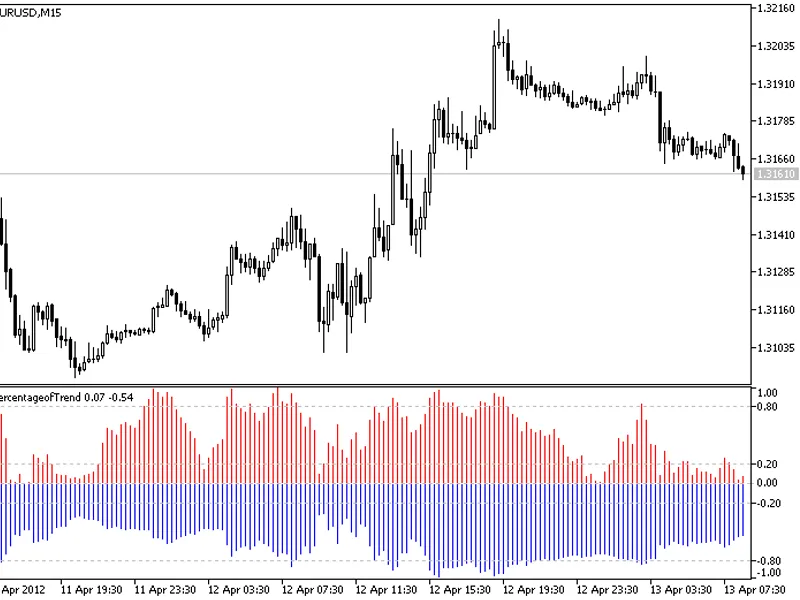
This indicator calculates the percentage of trend over two periods, providing insights into the market's direction.The formula for the first period (red color):(close - lowvalue) /...