YA B S I
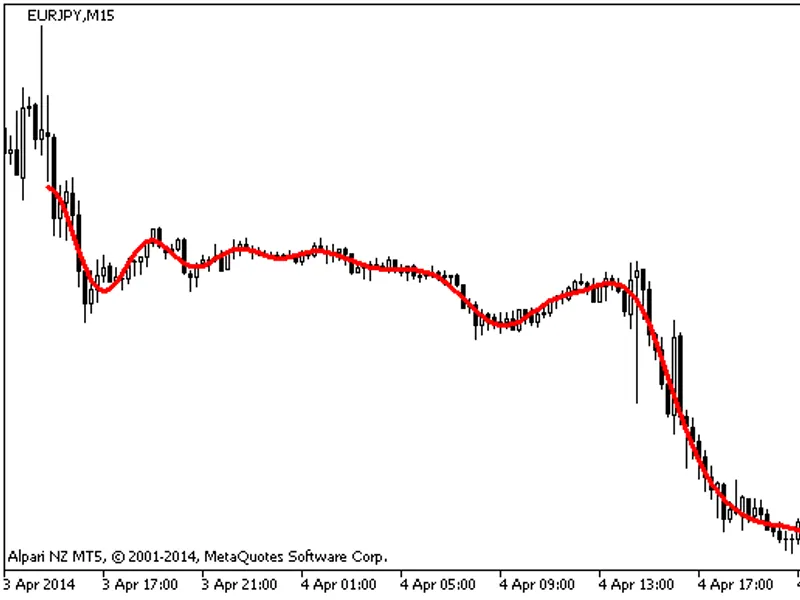
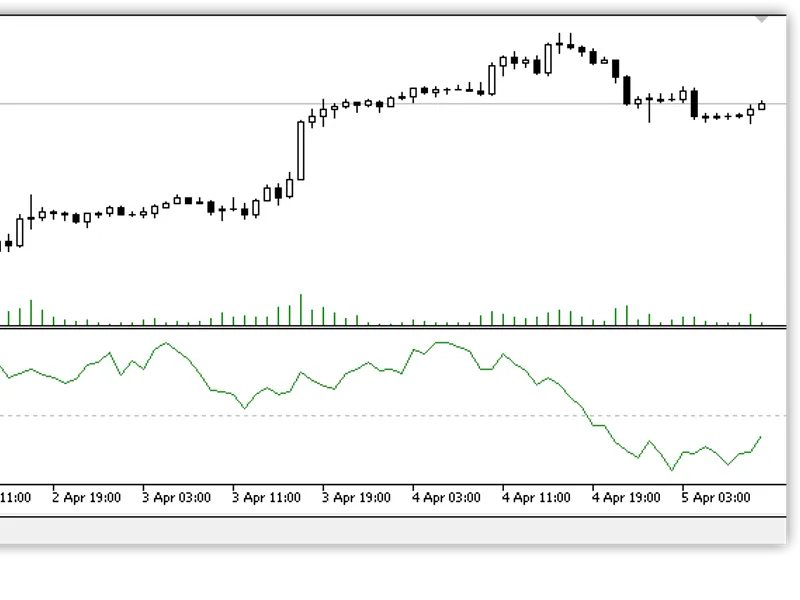
This tool for MetaTrader 5 is specifically engineered to streamline your trading operations. This technical indicator acts as a specialized analysis tool designed to visualize market data. It helps traders identify emerging trends, momentum shifts, and key support or resistance levels by plotting statistical calculations directly onto price charts.
How to Setup and Use YA B S I
1. Installation: Place your file in the MQL/Indicators folder via "Open Data Folder" and restart your terminal.
2. Loading: Find the indicator in the Navigator, drag it onto your chart, and configure the input parameters in the popup window.
3. Customization: Press Ctrl+I to open the indicator list, select your tool, and click "Properties" to change colors, levels, or visual styles.
4. Updating: Replace the old file in the Indicators folder with the new version and restart the platform to apply changes.
Frequently Asked Questions
Q: Why is my indicator not showing? A: Verify the file is in the MQL/Indicators folder, or try right-clicking the "Indicators" tree in the Navigator and clicking "Refresh."
Q: Do custom indicators slow down the platform? A: Too many complex indicators can impact performance; remove unused ones via the "Indicator List" (Ctrl+I).
Q: Can I use MT4 indicators on MT5? A: No, MQL4 and MQL5 are distinct languages; ensure the indicator is compiled specifically for your platform version.
Description & Settings
A signal indicator YABSI. It shows Buy and Sell labels on the price chart.
It has one parameter:
Show price typical
- display of the typical price line, based on which the calculation is performed, Yes/No.
Calculations:
if
(Close[1] < High and PriceTypical[2] < Close[1])
or
PriceTypical[3] < Close[1]
:
a Sell signal
.
If
(Close[1] > Low and PriceTypical[2] > Close[1])
or
PriceTypical[3] > Close[1]
:
a Buy signal
. Note that in order to avoid false entries, signals should be filtered using direction indicators, oscillators and overbought/oversold zones or support/resistance levels.