


WS I
Info
The WS I is a Indicator for MetaTrader 5 that the wave segregation index (wsi) oscillator is based on the ratio of two indicators: adx and cci. It is displayed as a colored histogram.
Usage
This tool is typically used for enhancing chart analysis and decision making.
Platform
This Indicator works exclusively on MetaTrader 5 (both build 600+ and newer versions).
Setup
Place the downloaded file in MQL5/Indicators folder via File ? Open Data Folder in MetaTrader 5.
How to Install and Use WS I
1. Installation: Place your file in the MQL/Indicators folder via "Open Data Folder" and restart your terminal.
2. Loading: Find the indicator in the Navigator, drag it onto your chart, and configure the input parameters in the popup window.
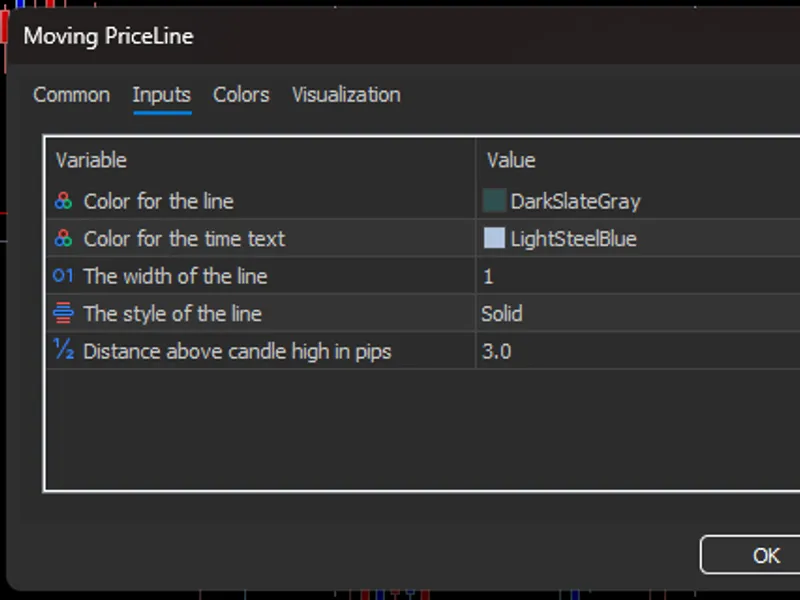
3. Customization: Press Ctrl+I to open the indicator list, select your tool, and click "Properties" to change colors, levels, or visual styles.
4. Updating: Replace the old file in the Indicators folder with the new version and restart the platform to apply changes.
Frequently Asked Questions
Q: Why is my indicator not showing? A: Verify the file is in the MQL/Indicators folder, or try right-clicking the "Indicators" tree in the Navigator and clicking "Refresh."
Q: Do custom indicators slow down the platform? A: Too many complex indicators can impact performance; remove unused ones via the "Indicator List" (Ctrl+I).
Q: Can I use MT4 indicators on MT5? A: No, MQL4 and MQL5 are distinct languages; ensure the indicator is compiled specifically for your platform version.
What this tool does
The Wave Segregation Index (WSI) oscillator is based on the ratio of two indicators: ADX and CCI.
Typical Use Case
This Indicator excels in automated trading and technical analysis on MetaTrader 5.
Compatible Platform & Setup
This Indicator works on MetaTrader 5. Place the file in the MQL5/Indicators folder and restart the terminal.
Description & Settings
Related: Price Channel Indicator - another powerful indicator for MetaTrader 5 traders.
The Wave Segregation Index (WSI) oscillator is based on the ratio of two indicators: ADX and CCI. It is displayed as a colored histogram.
Also recommended: Multi-Timeframe Moving Average Indicator (v03) - similar indicator with strong performance on MetaTrader 5.
It has two adjustable parameters:CCI period
- CCI calculation period
ADX period
- ADX calculation period
Calculations:
WSI = (CCI * PriceTypical * ADX) / 1000.0
where:
CCI = CCI(PRICE_TYPICAL, CCI period)
ADX = ADX(ADX period)
PriceTypical = (High+Low+Close)/3
⚠ Limitations & Risk Warning
- This tool is provided for educational and testing purposes only.
- Past performance does not guarantee future results.
- Trading involves substantial risk of loss. Use on a demo account first.
- Results may vary depending on market conditions, broker, and settings.
- We recommend thorough backtesting and forward testing before using with real funds.