WP V H
This professional-grade solution for MetaTrader 5 helps traders achieve greater efficiency in their daily workflow. This technical indicator acts as a specialized analysis tool designed to visualize market data. It helps traders identify emerging trends, momentum shifts, and key support or resistance levels by plotting statistical calculations directly onto price charts.
How to Setup and Use WP V H
1. Installation: Place your file in the MQL/Indicators folder via "Open Data Folder" and restart your terminal.
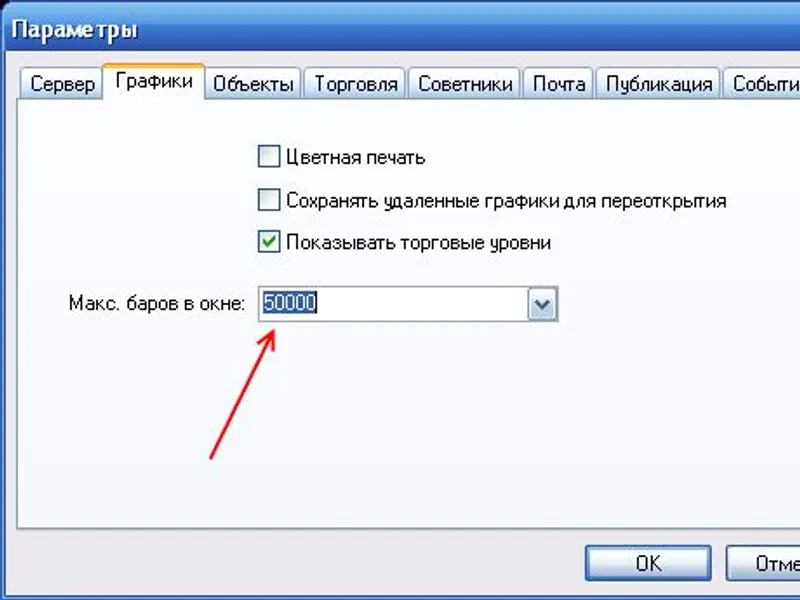
2. Loading: Find the indicator in the Navigator, drag it onto your chart, and configure the input parameters in the popup window.
3. Customization: Press Ctrl+I to open the indicator list, select your tool, and click "Properties" to change colors, levels, or visual styles.
4. Updating: Replace the old file in the Indicators folder with the new version and restart the platform to apply changes.
Frequently Asked Questions
Q: Why is my indicator not showing? A: Verify the file is in the MQL/Indicators folder, or try right-clicking the "Indicators" tree in the Navigator and clicking "Refresh."
Q: Do custom indicators slow down the platform? A: Too many complex indicators can impact performance; remove unused ones via the "Indicator List" (Ctrl+I).
Q: Can I use MT4 indicators on MT5? A: No, MQL4 and MQL5 are distinct languages; ensure the indicator is compiled specifically for your platform version.
Description & Settings
The Wyckoff PriceVolume Histogram oscillator indicator allows analyzing the market by applying Richard Wyckoff's volume spread analysis VSA.
Here the "spread" does not mean Ask-Bid, but the full size of the candle: High-Low.
The indicator has three input parameters:
Fast period
- fast smoothing period
Slow period
- slow smoothing period
Show histogram
- show the histogram
First, the candlestick "profile" is calculated. Then, based on the obtained profile, the candlestick's "volume weight" is calculated, and then the histogram value is calculated by subtracting the past candlestick profile from the current profile. To draw the average values, two SMAs with different periods are calculated - fast and slow - based on the candlestick profiles.
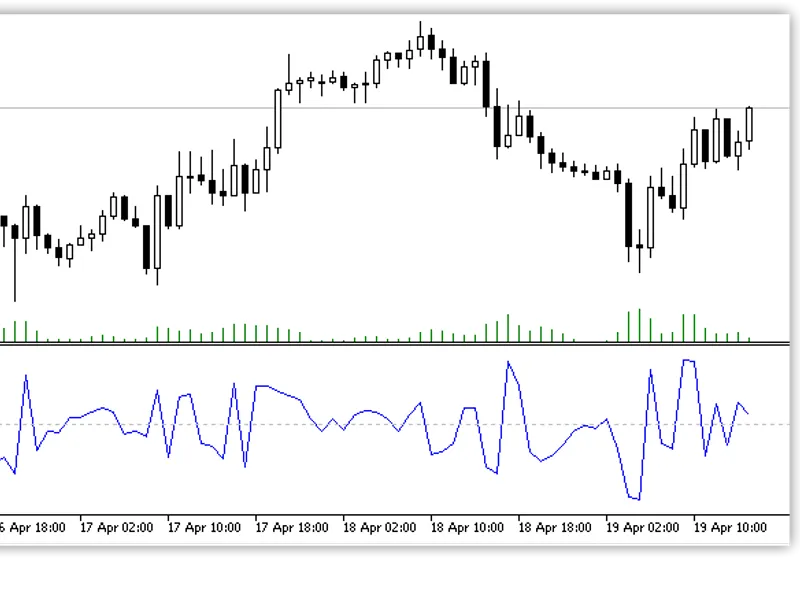
If Show histogram = Yes, an additional histogram is drawn showing the differences between the past and current profiles.
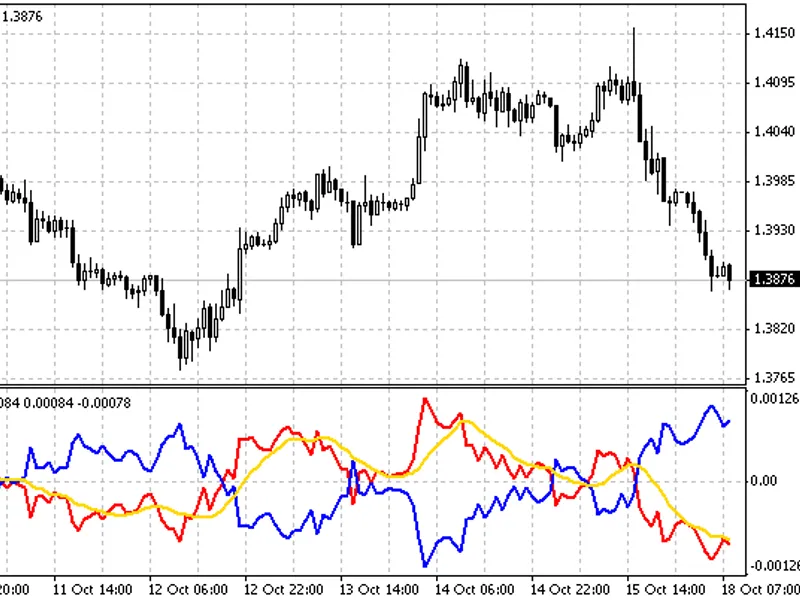
Fig. 1. Show histogram = No
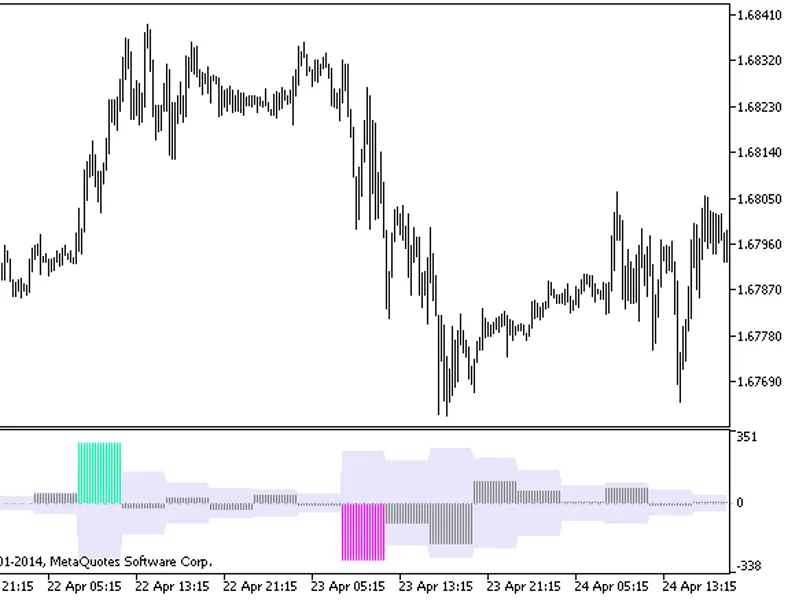
Fig. 2. Show histogram = Yes
,