WKB I B S
This professional-grade solution for MetaTrader 5 helps traders achieve greater efficiency in their daily workflow. This technical indicator acts as a specialized analysis tool designed to visualize market data. It helps traders identify emerging trends, momentum shifts, and key support or resistance levels by plotting statistical calculations directly onto price charts.
How to Setup and Use WKB I B S
1. Installation: Place your file in the MQL/Indicators folder via "Open Data Folder" and restart your terminal.
2. Loading: Find the indicator in the Navigator, drag it onto your chart, and configure the input parameters in the popup window.
3. Customization: Press Ctrl+I to open the indicator list, select your tool, and click "Properties" to change colors, levels, or visual styles.
4. Updating: Replace the old file in the Indicators folder with the new version and restart the platform to apply changes.
Frequently Asked Questions
Q: Why is my indicator not showing? A: Verify the file is in the MQL/Indicators folder, or try right-clicking the "Indicators" tree in the Navigator and clicking "Refresh."
Q: Do custom indicators slow down the platform? A: Too many complex indicators can impact performance; remove unused ones via the "Indicator List" (Ctrl+I).
Q: Can I use MT4 indicators on MT5? A: No, MQL4 and MQL5 are distinct languages; ensure the indicator is compiled specifically for your platform version.
Description & Settings
Rosh
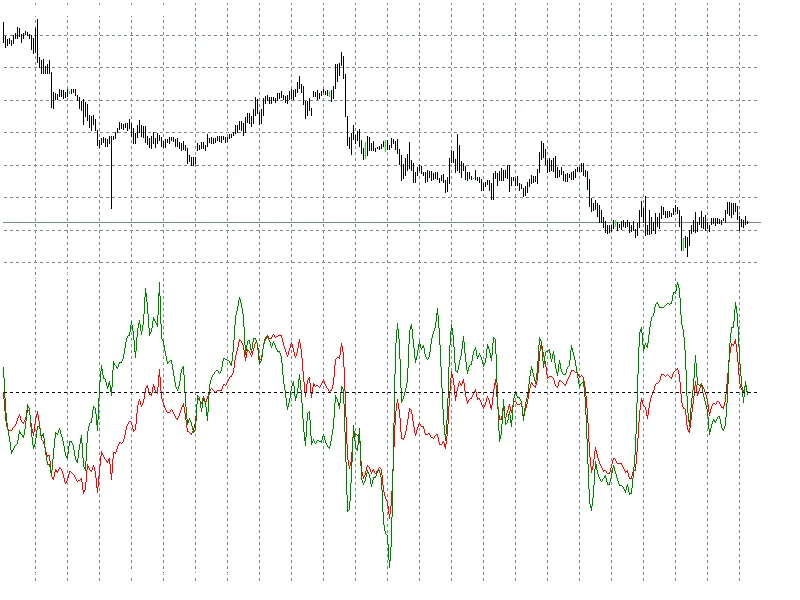
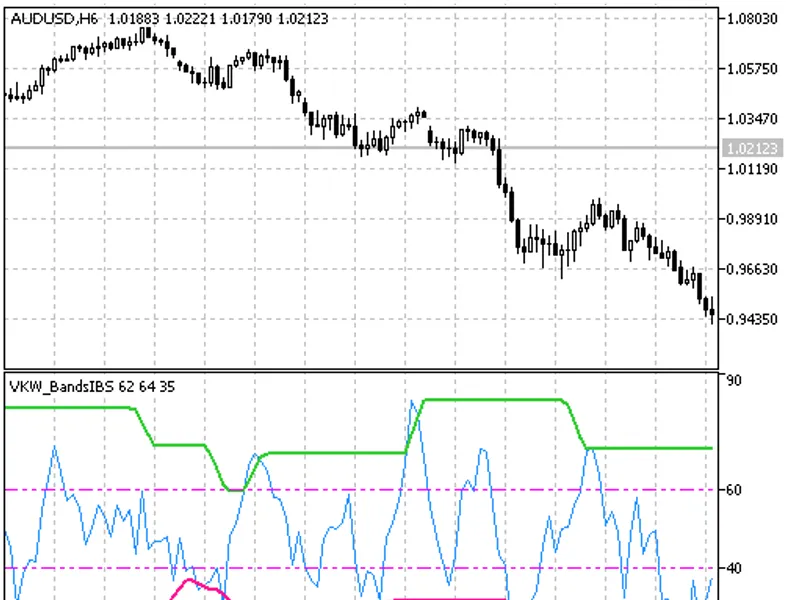
WKBIBS is a next generation oscillator with combined WKB and indicators functions.
This indicator is quite suitable even for the beginner at Forex, also it will be a good addition to a trading system of a professional. WKBIBS gives the earliest signals in comparison to standard type oscillators. In contrast to all arrow indicators, it neither gives false signals, nor it redraws. WKBIBS is not more complex visually than arrow indicators but it gives more early and correct signals.
Usage:
When the blue oscillator crosses the upper green line downwards, it is time to sell, and if the blue oscillator crosses the lower red line upwards, it is time to buy. It's very simple, and most importantly, very clear: at the moment when a signal appears, a price on a chart is still actual for entering the market in the appropriate direction. The rest features including the possible use of a trend filter and preferred trades direction you can choose for yourself.
Input parameters:
This indicator allows to change smoothing method:
- simple moving average;
- exponential moving average;
- smoothed moving average;
- linear weighted moving average;
- JMA adaptive average;
- ultralinear smoothing;
- parabolic smoothing;
- Tillson's multiple exponential smoothing;
- smoothing with the use of Tushar Chande's algorithm;
- smoothing with the use of Perry Kaufman's algorithm.
It should be noted that Phase type parameters for different smoothing algorithms have completely different meaning. For JMA it is an external Phase variable changing from -100 to +100. For T3 it is a smoothing ratio multiplied by 100 for better visualization, for VIDYA it is a CMO oscillator period and for AMA it is a slow EMA period. In other algorithms these parameters do not affect smoothing. For AMA fast EMA period is a fixed value and is equal to 2 by default. The ratio of raising to the power is also equal to 2 for AMA.
The indicator uses SmoothAlgorithms.mqh library classes (must be copied to the terminal_data_folder\MQL5\Include). The use of the classes was thoroughly described in the article .
This indicator was first implemented in MQL4 and published in 11.10.2008.