VS I
What this tool does
The VS I is a Indicator for MetaTrader 5 that vsi - volatility switch indicator. The indicator measures the current volatility with respect to historical data for the selected period.
Typical Use Case
This tool is typically used for enhancing chart analysis and decision making.
Compatible Platform
This Indicator works exclusively on MetaTrader 5 (both build 600+ and newer versions).
Setup Location
Place the downloaded file in MQL5/Indicators folder via File ? Open Data Folder in MetaTrader 5.
How to Install and Use VS I
1. Installation: Place your file in the MQL/Indicators folder via "Open Data Folder" and restart your terminal.
2. Loading: Find the indicator in the Navigator, drag it onto your chart, and configure the input parameters in the popup window.
3. Customization: Press Ctrl+I to open the indicator list, select your tool, and click "Properties" to change colors, levels, or visual styles.
4. Updating: Replace the old file in the Indicators folder with the new version and restart the platform to apply changes.
Frequently Asked Questions
Q: Why is my indicator not showing? A: Verify the file is in the MQL/Indicators folder, or try right-clicking the "Indicators" tree in the Navigator and clicking "Refresh."
Q: Do custom indicators slow down the platform? A: Too many complex indicators can impact performance; remove unused ones via the "Indicator List" (Ctrl+I).
Q: Can I use MT4 indicators on MT5? A: No, MQL4 and MQL5 are distinct languages; ensure the indicator is compiled specifically for your platform version.
Description & Settings
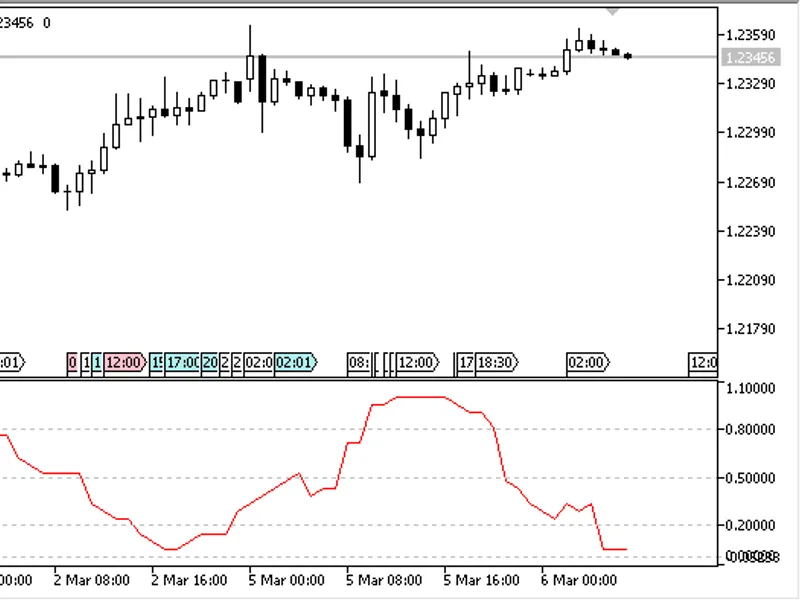
VSI - Volatility Switch Indicator. The indicator measures the current volatility with respect to historical data for the selected period. It allows to evaluate the market state. The range of the indicator values is normalized from 0 to 1.
When the indicator value rises above 0.5, volatility in the market increases, and one can expect that the price movement will speed up and there will be sharp movements. When the indicator value drops below 0.5 after high values, volatility decreases, which can be considered a sign of trend formation.
The indicator has three input parameters:
Period
- calculation period;
Overbought
- overbought level;
Oversold
- oversold level.