
Volatility Regime Indicator
Info
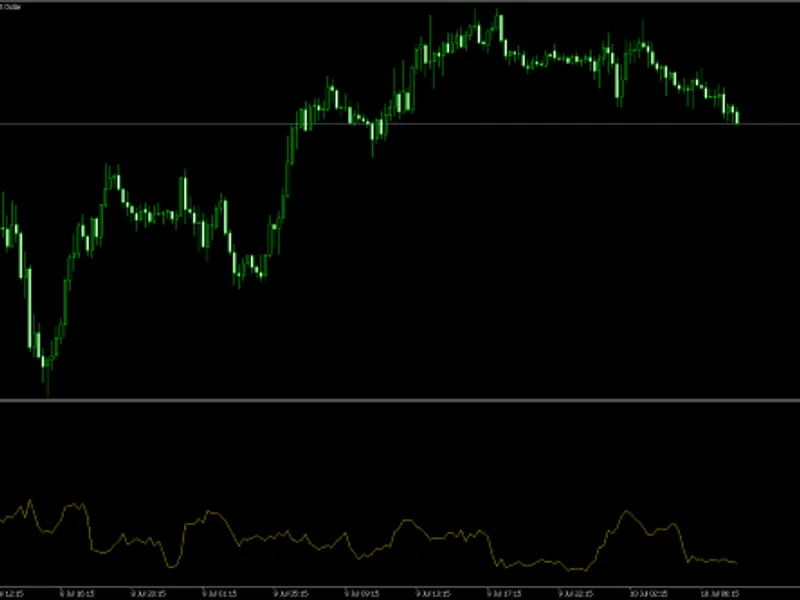
The Volatility Regime Indicator is a Indicator for MetaTrader 5 that what the indicator doesthis is a volatility regime indicator, displayed in a separate window below the chart. The core idea: it calculates a historical percentile of the current volatility (0-100%) and classifies the market into 5 "regimes" — from extreme calm to extreme chaos.
Usage
This tool is typically used for enhancing chart analysis and decision making.
Platform
This Indicator works exclusively on MetaTrader 5 (both build 600+ and newer versions).
Setup
Place the downloaded file in MQL5/Indicators folder via File ? Open Data Folder in MetaTrader 5.
How to Install and Use Volatility Regime Indicator
1. Installation: Place your file in the MQL/Indicators folder via "Open Data Folder" and restart your terminal.
2. Loading: Find the indicator in the Navigator, drag it onto your chart, and configure the input parameters in the popup window.
3. Customization: Press Ctrl+I to open the indicator list, select your tool, and click "Properties" to change colors, levels, or visual styles.
4. Updating: Replace the old file in the Indicators folder with the new version and restart the platform to apply changes.
Frequently Asked Questions
Q: Why is my indicator not showing? A: Verify the file is in the MQL/Indicators folder, or try right-clicking the "Indicators" tree in the Navigator and clicking "Refresh."
Q: Do custom indicators slow down the platform? A: Too many complex indicators can impact performance; remove unused ones via the "Indicator List" (Ctrl+I).
Q: Can I use MT4 indicators on MT5? A: No, MQL4 and MQL5 are distinct languages; ensure the indicator is compiled specifically for your platform version.
What this tool does
What the indicator doesThis is a volatility regime indicator, displayed in a separate window below the chart.
Typical Use Case
This Indicator excels in automated trading and technical analysis on MetaTrader 5.
Compatible Platform & Setup
This Indicator works on MetaTrader 5. Place the file in the MQL5/Indicators folder and restart the terminal.
Description & Settings
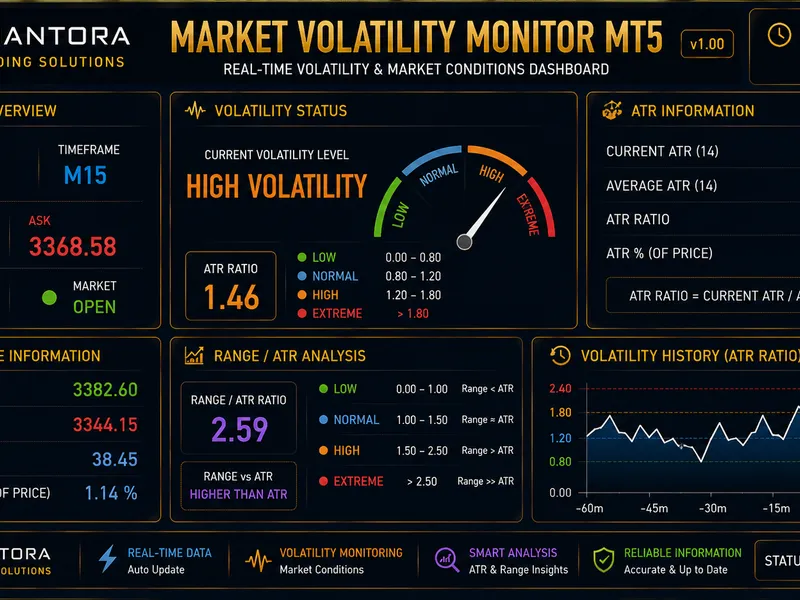
Related: Quantora Market Volatility Monitor MT5 - Professional ATR and Volatility Dashboard - another powerful indicator for MetaTrader 5 traders.
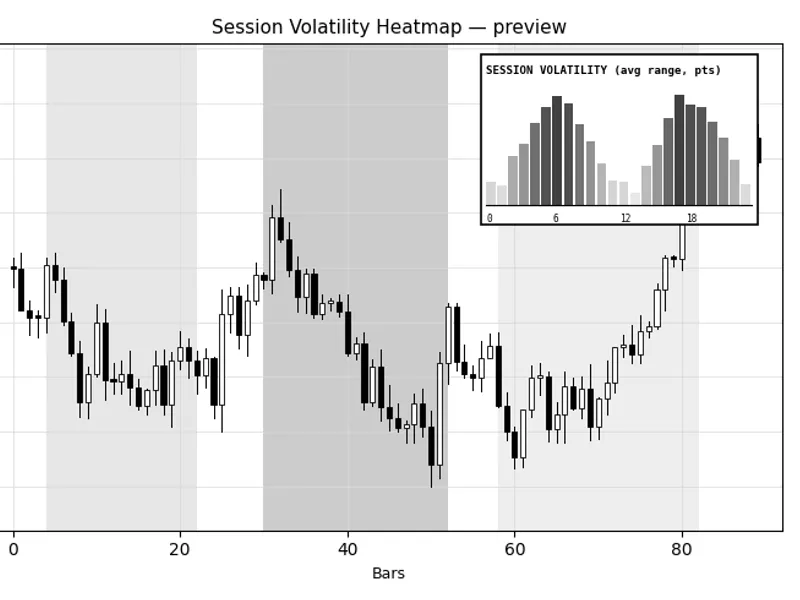
What the indicator doesAlso recommended: Session Volatility Heatmap - similar indicator with strong performance on MetaTrader 5.
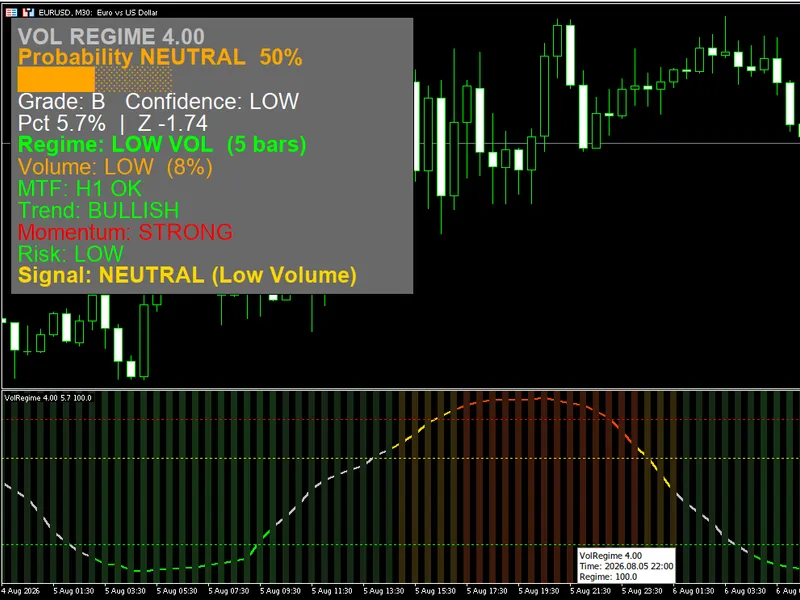
This is a volatility regime indicator, displayed in a separate window below the chart. The core idea: it calculates a historical percentile of the current volatility (0-100%) and classifies the market into 5 "regimes" — from extreme calm to extreme chaos. On top of that, it has a full visual dashboard (a text panel on the chart) with a trading signal, SL/TP, MTF (multi-timeframe) filters, volume, VIX, and a probabilistic "confidence meter" score.
How it actually calculates:
Calculates current volatility (ATR, Parkinson, or based on historical returns — see InpVolType).
Compares it against the last InpLookback bars → obtains a percentile (e.g., 85% = today's volatility is higher than 85% of the last N bars).
The percentile is mapped to 5 regimes, based on the InpLow / InpElevated / InpExtreme thresholds.
A persistence filter (InpPersist) prevents the regime from flipping on every small fluctuation.
On top of the regime, a separate module generates a BUY/SELL signal, strictly gated by regime + MTF + volume.
Full explanation of the inputs
Group "Core"
InpPeriod (14)
— base period for the volatility calculation (e.g., ATR period, or the Parkinson/returns window).
InpLookback (100)
— number of historical bars used to calculate the percentile of current volatility. The larger it is, the more "stable" the percentile is over the long run, but the slower it reacts to structural shifts.
InpSmooth (3)
— smoothing (simple moving average) applied to the percentile line, so it isn't jagged.
Group "Volatility"
InpVolType (PARKINSON)
— the volatility calculation method:
ATR — classic Average True Range.
PARKINSON — estimator based on the logarithmic High-Low range (statistically more efficient than ATR for intraday volatility, but ignores gaps).
HIST — standard historical volatility, based on the standard deviation of close-to-close log returns.
Group "Regime Levels"
InpLow (20.0)
— below this percentile → LOW VOL regime.
InpElevated (65.0)
— above this percentile → ELEVATED regime.
InpExtreme (85.0)
— above this percentile → HIGH VOL regime (and above 95%, automatically → EXTREME, hardcoded in the code).
Resulting regimes: LOW VOL (1) → NORMAL (0) → ELEVATED (2) → HIGH VOL (3) → EXTREME (4).
Group "Filters"
InpPersist (3)
— how many consecutive bars must confirm a new regime before it's actually displayed. Reduces regime flicker/noise.
InpMTF (true)
— enables the check on a higher timeframe.
InpMTFPeriod (H1)
— the timeframe used for the MTF check. If it's lower than or equal to the current chart timeframe, the indicator automatically steps up to the next standard TF (H1→H4→D1→W1→MN1).
InpVolFilter (true)
— enables the volume (tick volume) filter as a signal-blocking condition.
InpVolLookback (50)
— the historical window for the volume percentile.
InpLowVolPct (25.0)
— below this volume percentile → considered "low volume," blocks the signal.
Group "Signal & Risk"
InpMAPeriod (50)
— the MA (EMA) period used as a reference line for trend direction (price above/below MA).
InpSL_Mult (1.5)
— ATR multiplier for the Stop Loss distance.
InpMinRR (1.5)
— the minimum Risk:Reward ratio accepted as "OK" (display only, does not block the signal).
InpTP_RR (2.0)
— the R:R ratio actually used to calculate the Take Profit.
Group "VIX"
InpVIX ("VIX")
— the symbol used to read an external volatility index (if the broker offers it). If the symbol doesn't exist, the VIX section of the dashboard disappears automatically.
InpVIXHigh (25.0)
— the threshold above which VIX is flagged as "high" (red color).
Group "Colors"
All the colors for each component (LOW/NORMAL/ELEVATED/HIGH/EXTREME regime, panel background, text, title, BUY, SELL, warning, muted, chart background). Purely cosmetic — they don't affect the logic.
Group "Visual"
InpShowDash (true)
— shows/hides the text panel on the chart.
InpShowBG (true)
— shows the colored background histogram by regime (indicator subwindow).
InpChartBG (true)
— colors the main chart background when the regime is HIGH/EXTREME (a strong visual warning).
InpFontSize (11)
— font size in the panel.
Group "Alerts"
InpAlertChange (true)
— alert on any regime change.
InpAlertLow (true)
— specific alert when entering LOW VOL.
InpAlertExtr (true)
— specific alert when entering HIGH/EXTREME.
Group "Performance"
InpDashThrottleMs (200)
— minimum interval (ms) between "heavy" dashboard refreshes (MTF, VIX, drawing objects). Doesn't affect the volatility line calculation itself, only the UI, to avoid CPU strain on symbols with a high tick rate.
What the dashboard (corner panel) shows
Probability BUY/SELL/NEUTRAL %
+ visual bar + Grade (AAAA→C) + Confidence — a composite heuristic score (trend + momentum + volume + MTF + regime), not the actual trading condition.
Pct / Z
— the raw volatility percentile and Z-score.
Regime
— current regime + duration in bars.
Volume
— HIGH/MEDIUM/LOW.
MTF
— the state of confluence on the higher timeframe.
Trend / Momentum / Risk
— quick labels.
Signal
— the actual signal (BUY/SELL/NEUTRAL, with the reason if blocked).
SL/TP/R:R
— if there's an active signal.
VIX
— if the symbol is available at the broker.
Important: The actual trading signal is generated ONLY when regime==1 (strictly LOW VOL) AND MTF confirms AND volume is not low. The "Probability" score at the top is independent and more permissive — it can show BUY 87% even if the Signal says NEUTRAL, because they're calculated with different logic.
Below your price chart, in its own little strip, this indicator draws a simple visual gauge of how volatile the market currently is.
What you see
A wavy line that moves up and down between 0% and 100%. The higher it is, the more unusual (bigger) today's price swings are compared to recent history. The lower it is, the calmer the market has been.
A colored band filling the background of that strip, which shifts color depending on how calm or wild things are right now.
Three faint dotted horizontal lines marking the boundaries between "calm," "elevated," and "extreme" — so you can instantly see how close the wavy line is to crossing into a more dangerous zone.
What happens as conditions change
When the market is quiet, the line sits low and the background turns green — signaling calm, more predictable price action.
As volatility creeps up, the color shifts to gray/silver (normal), then gold (elevated — starting to heat up), then orange (high), and finally red (extreme — genuinely wild conditions).
The line itself rises and falls smoothly with volatility, so you can watch it approach one of the dotted threshold lines and get an early sense that a shift is coming, before the color even changes.
Once the line crosses a threshold and stays there for a bit (rather than just spiking for one moment), the color of both the line and the background updates to reflect the new state.
What it's useful for, visually
Scrolling back through history in this strip lets you see exactly when the market moved between calm and chaotic phases in the past — the colored band makes those transitions easy to spot without reading any numbers. It works purely as a visual "temperature strip" for volatility, separate from the buy/sell suggestions and other details shown elsewhere on the main chart.
Trading methods with this indicator
1. Mean-reversion in the LOW VOL regime (the indicator's "native" method)
Wait for Signal: BUY or SELL (i.e., regime==1 + MTF OK + volume OK). Enter in the direction of price relative to the MA(50), with SL = ATR×1.5 and TP at a 2:1 R:R (already calculated by the indicator). This is a "calm before continuation" type strategy — low volatility plus a confirmed trend on the higher timeframe.
2. Breakout at the LOW VOL → ELEVATED/HIGH transition
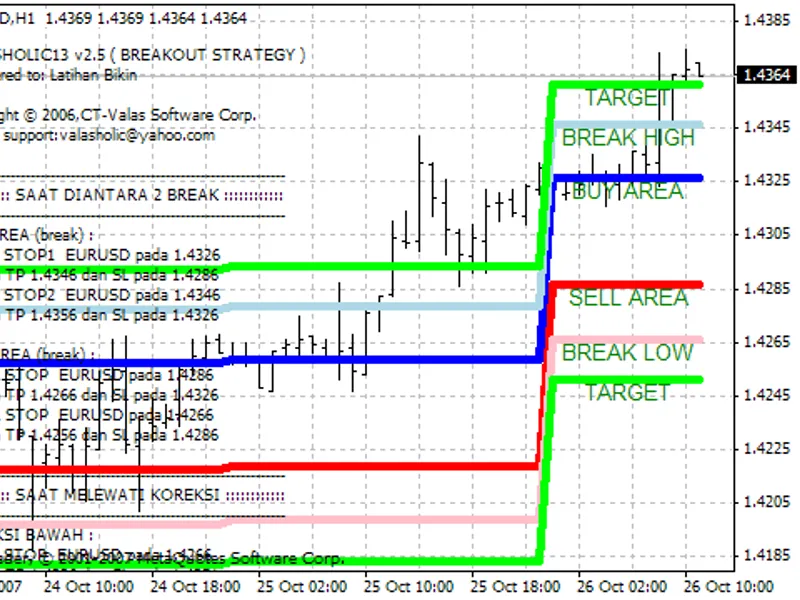
Prolonged low volatility (shown as a large duration next to Regime) often precedes a sudden expansion. Place pending orders (buy stop/sell stop) on both sides of the range formed during LOW VOL, triggered by the regime shift toward ELEVATED. The InpAlertChange alert notifies you at exactly that moment.
3. Risk filter / position sizing for other strategies
Instead of trading the indicator's signal directly, use it as a filter: reduce or avoid opening new positions (with another strategy) when the regime is HIGH/EXTREME (InpChartBG colors the chart as a warning), and increase position size/frequency when the regime is LOW/NORMAL.
4. Fade on EXTREME + high VIX
When the regime is EXTREME and VIX is above InpVIXHigh, volatility statistically tends to revert to the mean. This is a contrarian strategy, generally riskier, usually applied on higher timeframes — entering against the extreme impulse, with a wide stop, betting on normalization.
5. Using the "Probability" score as an additional quality threshold
Even when the Signal is active (BUY/SELL), you can filter further and require Grade AAA/AAAA + Confidence HIGH before entering, ignoring signals with a B/C grade. This increases selectivity but reduces trade frequency.
Caution: the probability score is a heuristic combination of already-calculated indicators (trend/momentum/volume/MTF/regime), not a statistically validated model backtested on historical data — the percentage does not represent a real win probability. Any of the methods above should be tested via backtesting/forward-testing before use with real money, especially the regime thresholds (InpLow/Elevated/Extreme) and InpPersist, which vary significantly by instrument and timeframe.
You may also like: KCI Volatility Distance - excellent alternative for indicator users on MetaTrader 5.
Source Code
#property copyright "RobotFX"
#property link "https://robotfx.org"
#property version   "4.10"
#property description "This code is educational. Feel free to use, modify and upgrade as you wish. Visit ROBOTFX.ORG for professional trading tools"
#property indicator_separate_window
#property indicator_buffers 4
#property indicator_plots   2
#property indicator_minimum 0
#property indicator_maximum 100
#property indicator_label1  "Vol %"
.......
⚠ Limitations & Risk Warning
- This tool is provided for educational and testing purposes only.
- Past performance does not guarantee future results.
- Trading involves substantial risk of loss. Use on a demo account first.
- Results may vary depending on market conditions, broker, and settings.
- We recommend thorough backtesting and forward testing before using with real funds.