Volatility adjusted WP R
This tool for MetaTrader 5 is specifically engineered to streamline your trading operations. This technical indicator acts as a specialized analysis tool designed to visualize market data. It helps traders identify emerging trends, momentum shifts, and key support or resistance levels by plotting statistical calculations directly onto price charts.
How to Setup and Use Volatility adjusted WP R
1. Installation: Place your file in the MQL/Indicators folder via "Open Data Folder" and restart your terminal.
2. Loading: Find the indicator in the Navigator, drag it onto your chart, and configure the input parameters in the popup window.
3. Customization: Press Ctrl+I to open the indicator list, select your tool, and click "Properties" to change colors, levels, or visual styles.
4. Updating: Replace the old file in the Indicators folder with the new version and restart the platform to apply changes.
Frequently Asked Questions
Q: Why is my indicator not showing? A: Verify the file is in the MQL/Indicators folder, or try right-clicking the "Indicators" tree in the Navigator and clicking "Refresh."
Q: Do custom indicators slow down the platform? A: Too many complex indicators can impact performance; remove unused ones via the "Indicator List" (Ctrl+I).
Q: Can I use MT4 indicators on MT5? A: No, MQL4 and MQL5 are distinct languages; ensure the indicator is compiled specifically for your platform version.
Description & Settings
This is volatility adjusted WPR (Williams Percent Range). Volatility used for adjusting is the "simple volatility" (no need for it, it is already incorporated in the code of this indicator)
There are 2 deviations compared to original WPR:
in order to display histogram in a simple way (without usage of 2 extra buffers), the value of WPR is shifted by +50 (ie: up)
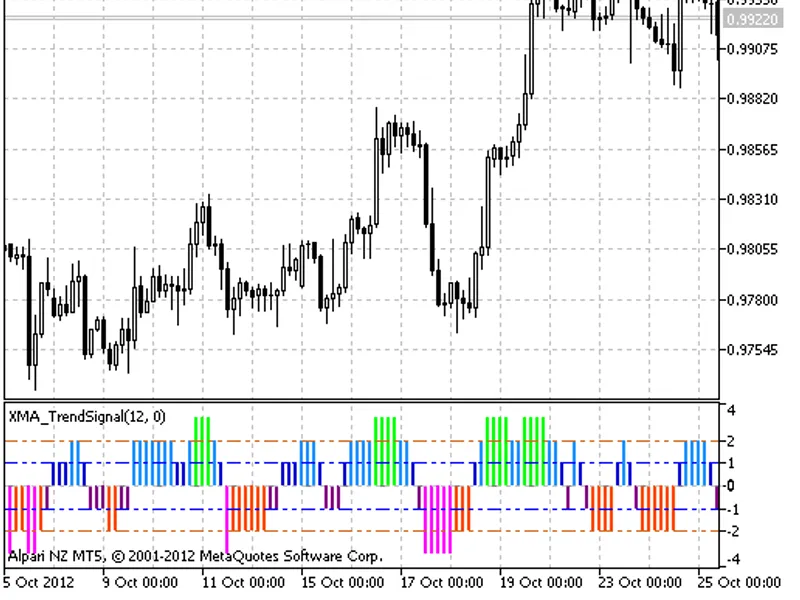
PS: an example why the smoothing seems to be necessary for WPR. 3 instances of WPR :
top most - the smoothed volatility adjusted
middle - volatility adjusted without smoothing
lowest - "regular" WPR
Which one would you use for trading decision on that chart?