Trix
This is a powerful addition to your MetaTrader 5 toolkit designed to optimize market analysis and performance. This technical indicator acts as a specialized analysis tool designed to visualize market data. It helps traders identify emerging trends, momentum shifts, and key support or resistance levels by plotting statistical calculations directly onto price charts.
How to Setup and Use Trix
1. Installation: Place your file in the MQL/Indicators folder via "Open Data Folder" and restart your terminal.
2. Loading: Find the indicator in the Navigator, drag it onto your chart, and configure the input parameters in the popup window.
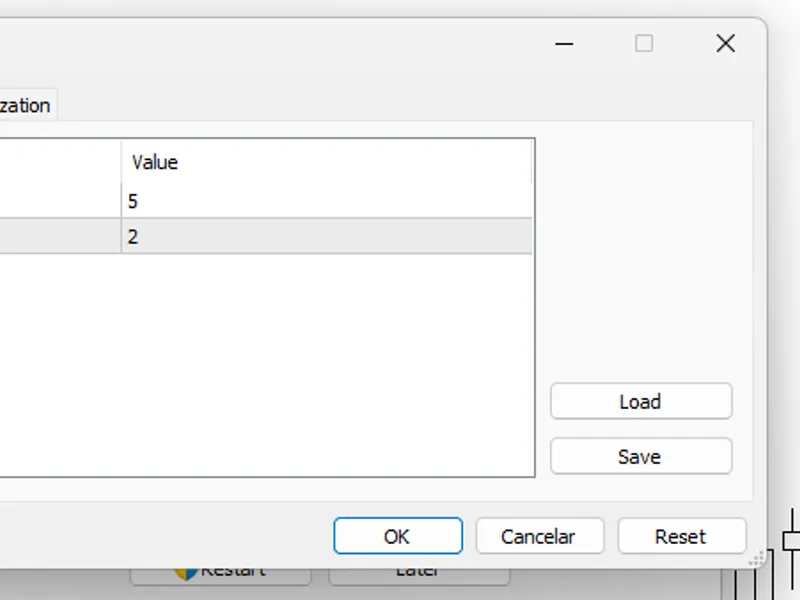
3. Customization: Press Ctrl+I to open the indicator list, select your tool, and click "Properties" to change colors, levels, or visual styles.
4. Updating: Replace the old file in the Indicators folder with the new version and restart the platform to apply changes.
Frequently Asked Questions
Q: Why is my indicator not showing? A: Verify the file is in the MQL/Indicators folder, or try right-clicking the "Indicators" tree in the Navigator and clicking "Refresh."
Q: Do custom indicators slow down the platform? A: Too many complex indicators can impact performance; remove unused ones via the "Indicator List" (Ctrl+I).
Q: Can I use MT4 indicators on MT5? A: No, MQL4 and MQL5 are distinct languages; ensure the indicator is compiled specifically for your platform version.
Description & Settings
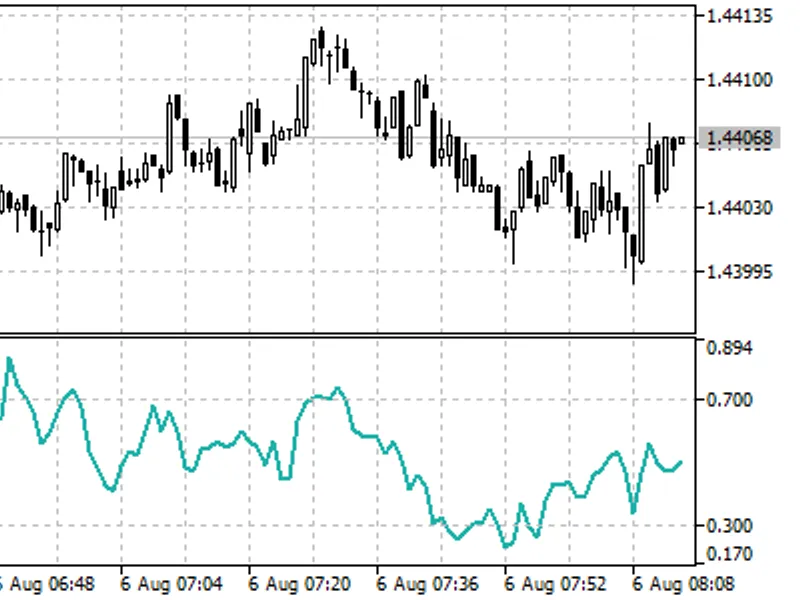
Trix oscillator is an oscillator based on the smoothed triple moving average. The indicator was developed in the early 1980's by Jack Hutson, an editor for "Technical Analysis of Stocks and Commodities" magazine.
There are seven configurable parameters:
Period
- calculation period
First MA method
- first MA calculation method
Second MA method
- second MA calculation method
Third MA method
- third MA calculation method
Signal period
- signal line calculation period
Signal method
- signal line calculation period
Applied price
Calculation:
where:
The equation is taken from Appel, Gerald: Winning Stock Market Systems. Signalert Corp., Great Neck, N.Y. 1974.
General rule:Buy when
Trix
is below zero and crosses its
signal line
upwards.Sell when
Trix
is above zero and crosses its
signal line
downwards.The histogram color change may serve as a preliminary signal that either forecasts the indicator lines crossing, or can be used to work on the price roll-backs.