






KCI Directional Matrix
Info
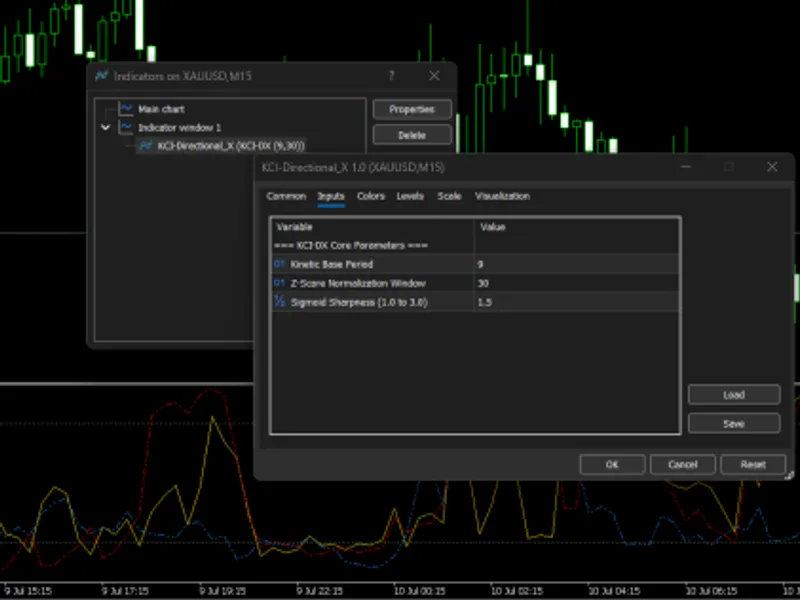
The KCI Directional Matrix is a Indicator for MetaTrader 5 that the kci-directional matrix (kci-dx) is an advanced, physics-inspired analytical tool that extracts market kinematics by measuring price path length and volatility energy. Unlike conventional momentum tools, KCI-DX employs a dynamic Z-Score normalization combined with a Sigmoid activation function.
Usage
This tool is typically used for enhancing chart analysis and decision making.
Platform
This Indicator works exclusively on MetaTrader 5 (both build 600+ and newer versions).
Setup
Place the downloaded file in MQL5/Indicators folder via File ? Open Data Folder in MetaTrader 5.
How to Install and Use KCI Directional Matrix
1. Installation: Place your file in the MQL/Indicators folder via "Open Data Folder" and restart your terminal.
2. Loading: Find the indicator in the Navigator, drag it onto your chart, and configure the input parameters in the popup window.
3. Customization: Press Ctrl+I to open the indicator list, select your tool, and click "Properties" to change colors, levels, or visual styles.
4. Updating: Replace the old file in the Indicators folder with the new version and restart the platform to apply changes.
Frequently Asked Questions
Q: Why is my indicator not showing? A: Verify the file is in the MQL/Indicators folder, or try right-clicking the "Indicators" tree in the Navigator and clicking "Refresh."
Q: Do custom indicators slow down the platform? A: Too many complex indicators can impact performance; remove unused ones via the "Indicator List" (Ctrl+I).
Q: Can I use MT4 indicators on MT5? A: No, MQL4 and MQL5 are distinct languages; ensure the indicator is compiled specifically for your platform version.
What this tool does
The KCI-Directional Matrix (KCI-DX) is an advanced, physics-inspired analytical tool that extracts market kinematics by measuring price path length and volatility energy.
Typical Use Case
This Indicator excels in automated trading and technical analysis on MetaTrader 5.
Compatible Platform & Setup
This Indicator works on MetaTrader 5. Place the file in the MQL5/Indicators folder and restart the terminal.
Description & Settings
Related: The Quantitative Microstructure Matrix - another powerful indicator for MetaTrader 5 traders.
The KCI-Directional Matrix (KCI-DX) is an advanced, physics-inspired analytical tool that extracts market kinematics by measuring price path length and volatility energy. Unlike conventional momentum tools, KCI-DX employs a dynamic Z-Score normalization combined with a Sigmoid activation function. This ensures the output is flawlessly bounded between 0 and 100, providing hyper-responsive trend strength identification and directional bias without distortion from historical extremes.Also recommended: Alpha Beta Trend Filter with Multi-Timeframe Matrix Dashboard - similar indicator with strong performance on MetaTrader 5.
KCI Directional Matrix (KCI-DX) is a quantitative directional analysis indicator designed to measure market efficiency, directional pressure, and trend expansion through a proprietary Kinetic Compression Index framework.
Key Features:
- Kinematic Directional Extraction: Calculates true market energy using path length variance.
- Dynamic Sigmoid Scaling: Adaptive normalization that prevents indicator flatlining.
- Three-Line Matrix: Consists of Main KCI (Trend/Compression Strength), +KDI (Bullish Kinematics), and -KDI (Bearish Kinematics).
Unlike conventional momentum oscillators, KCI-DX decomposes market movement into three independent dimensions:
- KCI Main: Measures overall directional efficiency and trend expansion strength.
- +KDI (Bullish Kinetic Directional Index): Quantifies bullish directional dominance.
- -KDI (Bearish Kinetic Directional Index): Quantifies bearish directional dominance.
The indicator combines kinematic directional extraction, path efficiency analysis, energy-weighted movement scoring, dynamic Z-Score normalization, and Sigmoid adaptive scaling. The result is a stable 0–100 directional matrix capable of identifying trend expansion, directional dominance, compression phases, momentum acceleration, volatility anomalies, and market regime transitions.
KCI-DX can be used as a standalone trading tool or as a feature-engineering component for Expert Advisors, machine learning systems, market scanners, adaptive grids, dynamic stop management, and portfolio-level decision engines.
Visualizing the Market Phases (The Zones):
- The Sleep Zone (0 to 20): The market is moving sideways, trapped in tight compression.
- The Action Zone (20 to 80): A new trend is born. Follow the Blue or Red dashed lines for direction.
- The Danger Zone (80 to 100): The current trend is extremely overextended and a reversal or deep correction is imminent.
Visual Trade Setups (Step-by-Step):
- SCENARIO A: The Bullish Breakout (BUY): Check the Gold Line and the Dashed Lines.
- SCENARIO B: The Bearish Breakdown (SELL): Check the Gold Line and the Dashed Lines.
- SCENARIO C: The Profit Take (EXIT): Check the Gold Line and secure profits.
Example EA Code using iCustom Call and Embedded Calculations are provided for developers to integrate the KCI-DX into their Expert Advisors.
Recommendations for Best Results:
- Asset Flexibility: Adjust the ZScorePeriod for highly volatile instruments.
- Algorithmic Optimization: Utilize the Embedded Calculation method for lightweight and self-contained Expert Advisors.
- Pairing for Confluence: Combine KCI-DX with structural filters or volume anomaly detectors for validation.
You may also like: institutional equilibrium matrix for mean-reverting assets - excellent alternative for indicator users on MetaTrader 5.
Source Code
#property copyright "RobotFX"
#property link "https://robotfx.org"
#property description "This code is educational. Feel free to use, modify and upgrade as you wish. Visit ROBOTFX.ORG for professional trading tools"
#property version     "1.0"
#property indicator_separate_window
#property indicator_minimum 0.0
#property indicator_maximum 100.0
#property indicator_buffers 6
#property indicator_plots   3
#property indicator_label1  "KCI Main"
.......
⚠ Limitations & Risk Warning
- This tool is provided for educational and testing purposes only.
- Past performance does not guarantee future results.
- Trading involves substantial risk of loss. Use on a demo account first.
- Results may vary depending on market conditions, broker, and settings.
- We recommend thorough backtesting and forward testing before using with real funds.