Tick Chart
This tool for MetaTrader 5 is specifically engineered to streamline your trading operations. This technical indicator acts as a specialized analysis tool designed to visualize market data. It helps traders identify emerging trends, momentum shifts, and key support or resistance levels by plotting statistical calculations directly onto price charts.
How to Setup and Use Tick Chart
1. Installation: Place your file in the MQL/Indicators folder via "Open Data Folder" and restart your terminal.
2. Loading: Find the indicator in the Navigator, drag it onto your chart, and configure the input parameters in the popup window.
3. Customization: Press Ctrl+I to open the indicator list, select your tool, and click "Properties" to change colors, levels, or visual styles.
4. Updating: Replace the old file in the Indicators folder with the new version and restart the platform to apply changes.
Frequently Asked Questions
Q: Why is my indicator not showing? A: Verify the file is in the MQL/Indicators folder, or try right-clicking the "Indicators" tree in the Navigator and clicking "Refresh."
Q: Do custom indicators slow down the platform? A: Too many complex indicators can impact performance; remove unused ones via the "Indicator List" (Ctrl+I).
Q: Can I use MT4 indicators on MT5? A: No, MQL4 and MQL5 are distinct languages; ensure the indicator is compiled specifically for your platform version.
Description & Settings
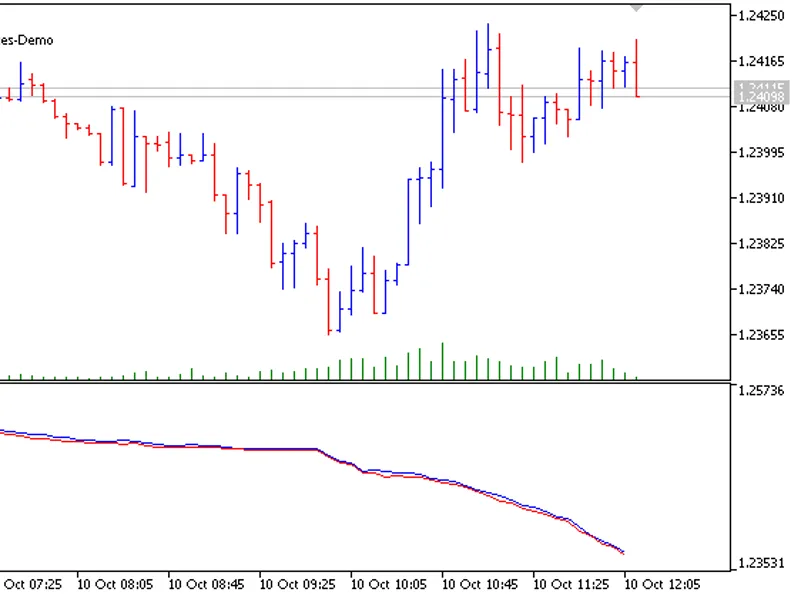
The indicator displays the Ask and Bid, which are taken from the real tick history. Also, it is possible to evaluate the spread changes by visually comparing the Ask and Bid.
The 2016.10.07 02:06:03 date is set in the indicator by default. This allows to see the events of GBP decline on the GBPUSD symbol:
As the indicator shows the Ask and Bid values, it is also possible to see what spread was.
Input parameters
:
amount requested by ticks — the number of requested ticks.
with a date query tics — the date to request ticks from.
timer — timer (milliseconds) for updating the indicator, essentially the rate of showing the tick history.
see how many bars — the number of visible ticks.