SZ O
This is a powerful addition to your MetaTrader 5 toolkit designed to optimize market analysis and performance. This technical indicator acts as a specialized analysis tool designed to visualize market data. It helps traders identify emerging trends, momentum shifts, and key support or resistance levels by plotting statistical calculations directly onto price charts.
How to Setup and Use SZ O
1. Installation: Place your file in the MQL/Indicators folder via "Open Data Folder" and restart your terminal.
2. Loading: Find the indicator in the Navigator, drag it onto your chart, and configure the input parameters in the popup window.
3. Customization: Press Ctrl+I to open the indicator list, select your tool, and click "Properties" to change colors, levels, or visual styles.
4. Updating: Replace the old file in the Indicators folder with the new version and restart the platform to apply changes.
Frequently Asked Questions
Q: Why is my indicator not showing? A: Verify the file is in the MQL/Indicators folder, or try right-clicking the "Indicators" tree in the Navigator and clicking "Refresh."
Q: Do custom indicators slow down the platform? A: Too many complex indicators can impact performance; remove unused ones via the "Indicator List" (Ctrl+I).
Q: Can I use MT4 indicators on MT5? A: No, MQL4 and MQL5 are distinct languages; ensure the indicator is compiled specifically for your platform version.
Description & Settings
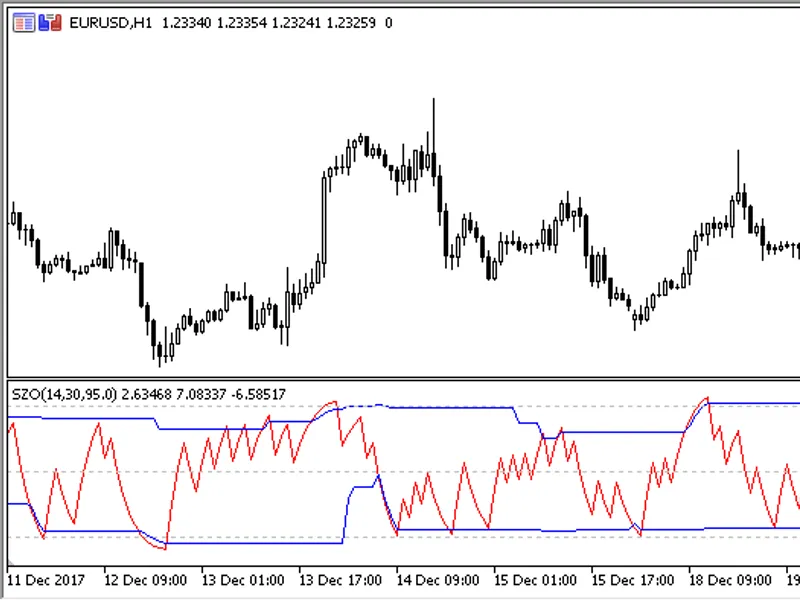
The SZO (Sentiment Zone Oscillator) indicator shows the market sentiment (activity and direction) and zones of excessive activity (overbought/oversold zones). It can display a dynamic channel, beyond which deals are seen as undesirable because of the high probability of a change in sentiment and of reversal.
If the indicator line moves beyond the channel and at the same time enters the overbought/oversold zone, this may mean that the market trend can change soon. The indicator often warns of such a possible change in advance, so it is advisable to use it in combination with another confirmation indicator.
It has six input parameters:
Period
- indicator calculation period;
Dynamic levels period
- the period for the calculation of the dynamic channel;
Dynamic levels percent
- the ratio of the channel size to the indicator range (*);
Overbought
- overbought level;
Oversold
- oversold level;
Show dynamic levels
- whether to show the levels of the dynamic channel (Yes/No).
* The ratio of the channel size to the indicator range is set in percent, but cannot be less than 50. I.e. the value of 50 means that the channel will only have one level located in the middle of the indicator range at the level of 0.0.
If you set a value less than 50, such a value will be automatically changed to 100.
Fig.1 Default channel range: 95%
Fig.2 Channel range 50%