Simple Trading System
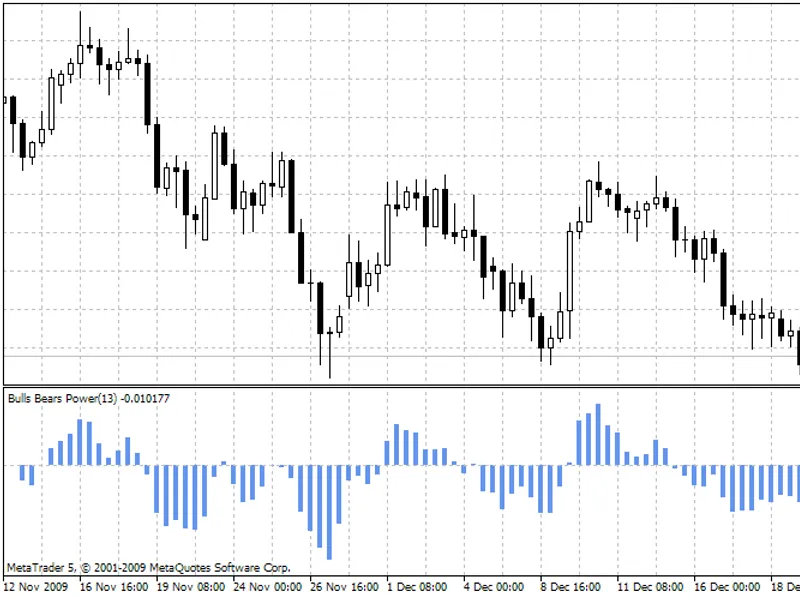
This software component for MetaTrader 5 is built to enhance the capabilities of your trading environment. This technical indicator acts as a specialized analysis tool designed to visualize market data. It helps traders identify emerging trends, momentum shifts, and key support or resistance levels by plotting statistical calculations directly onto price charts.
How to Setup and Use Simple Trading System
1. Installation: Place your file in the MQL/Indicators folder via "Open Data Folder" and restart your terminal.
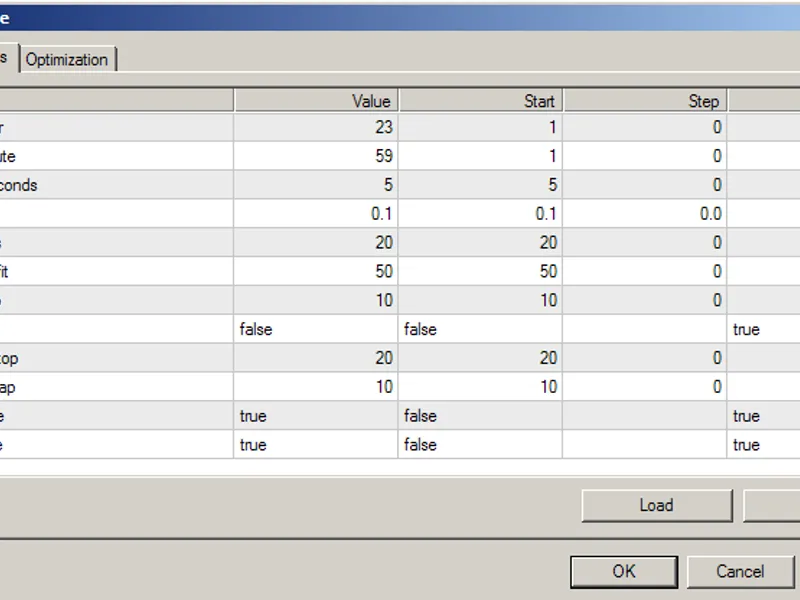
2. Loading: Find the indicator in the Navigator, drag it onto your chart, and configure the input parameters in the popup window.
3. Customization: Press Ctrl+I to open the indicator list, select your tool, and click "Properties" to change colors, levels, or visual styles.
4. Updating: Replace the old file in the Indicators folder with the new version and restart the platform to apply changes.
Frequently Asked Questions
Q: Why is my indicator not showing? A: Verify the file is in the MQL/Indicators folder, or try right-clicking the "Indicators" tree in the Navigator and clicking "Refresh."
Q: Do custom indicators slow down the platform? A: Too many complex indicators can impact performance; remove unused ones via the "Indicator List" (Ctrl+I).
Q: Can I use MT4 indicators on MT5? A: No, MQL4 and MQL5 are distinct languages; ensure the indicator is compiled specifically for your platform version.
Description & Settings
Vitalie Postolache
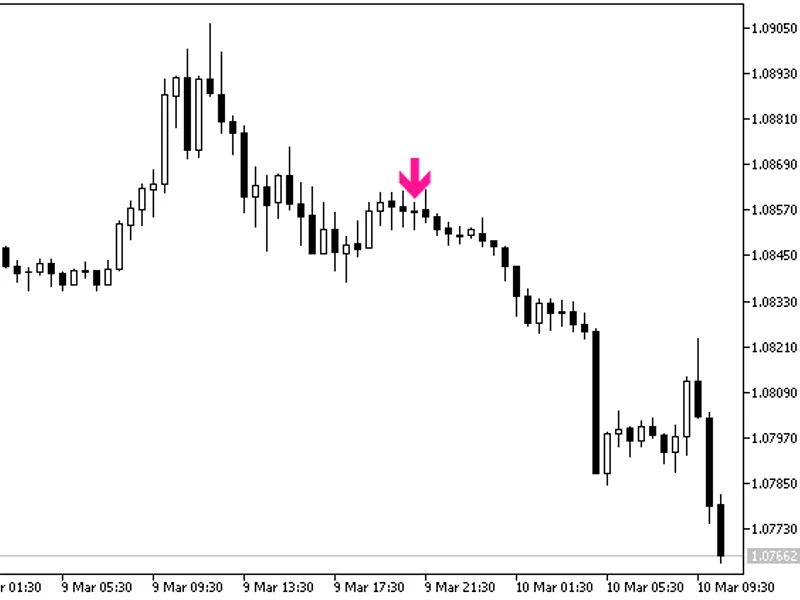
A semaphore signal indicator based in the idea from "325 golden strategies" collection.
Strategy principle:
Buy:
The closing average calculated by the X day period should be higher than the similar average Y days ago;
The closing price should be lower than the closing price Y days ago;
The closing price should be higher than the closing price Y+X days ago. If all three conditions are met, then you should buy at the next day opening;
The closing price should be lower than the opening price (bearish candlestick).
Sell:
The closing average calculated by the X day period should be lower than the similar average Y days ago;
The closing price should be higher than the closing price Y days ago;
The closing price should be lower than the closing price Y+X days ago.
The closing price should be higher than the opening price (bullish candlestick).
If all three conditions are met, then you should sell at the next day opening; For example, if Х=20 and Y=3, then the 20-day closing average should be higher (for buying) than the average calculated 3 days ago. It simply means that the 20-day closing average goes up. Next, today's closing price should be lower than the closing price 3 days ago. It helps to determine if there would be a pullback before entering the market.
Finally, the price should also be higher than 23 days ago (even if it is lower than 3 days ago). That way we check for an increasing moving average. The method will work until a turn signal appears or the market goes too far against the position without a turn signal.
Fig. 1. The Simple Trading System indicator