Relation - Chart Builder Legacy
This is a powerful addition to your MetaTrader 5 toolkit designed to optimize market analysis and performance. This technical indicator acts as a specialized analysis tool designed to visualize market data. It helps traders identify emerging trends, momentum shifts, and key support or resistance levels by plotting statistical calculations directly onto price charts.
How to Setup and Use Relation - Chart Builder Legacy
1. Installation: Place your file in the MQL/Indicators folder via "Open Data Folder" and restart your terminal.
2. Loading: Find the indicator in the Navigator, drag it onto your chart, and configure the input parameters in the popup window.
3. Customization: Press Ctrl+I to open the indicator list, select your tool, and click "Properties" to change colors, levels, or visual styles.
4. Updating: Replace the old file in the Indicators folder with the new version and restart the platform to apply changes.
Frequently Asked Questions
Q: Why is my indicator not showing? A: Verify the file is in the MQL/Indicators folder, or try right-clicking the "Indicators" tree in the Navigator and clicking "Refresh."
Q: Do custom indicators slow down the platform? A: Too many complex indicators can impact performance; remove unused ones via the "Indicator List" (Ctrl+I).
Q: Can I use MT4 indicators on MT5? A: No, MQL4 and MQL5 are distinct languages; ensure the indicator is compiled specifically for your platform version.
Description & Settings
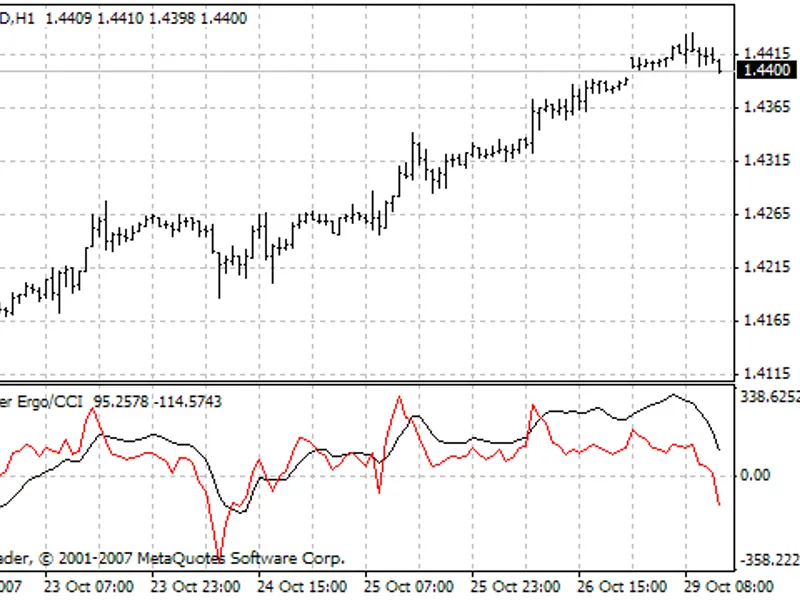
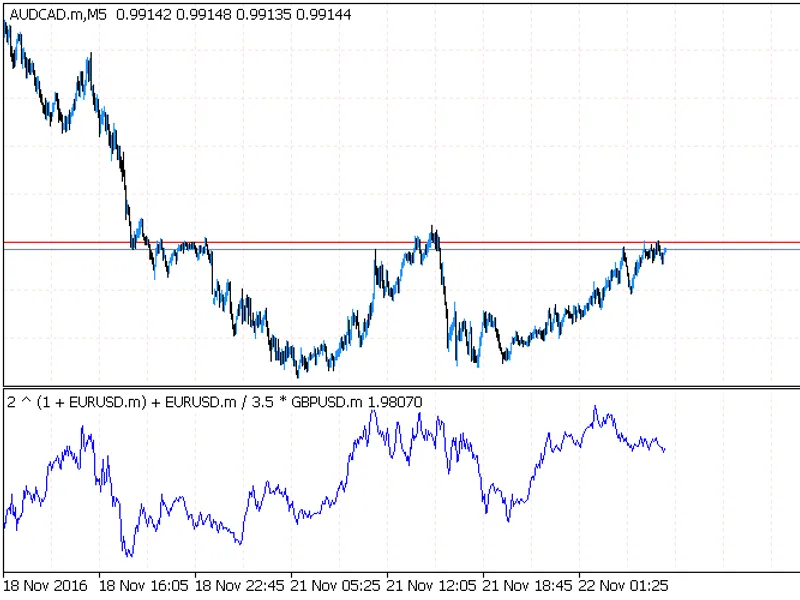
Indicator for building custom charts, which are based on user-defined formula.
Charts are drawn in bars of the timeframe specified in the indicator settings. Charts of the selected instruments are synchronized in time.
Spaces in the formula are optional, fractional numbers are only specified using the point.
To avoid inconsistency in measurement units and to convert everything into the deposit currency, set the InpAlign parameter to true
Supported operations, by priority of execution:
Parentheses: (a ... b)Exponentiation: a ^ bDivision: a / bMultiplication: a * bAddition: a + bSubtraction: a - b
Example of application, to find the separation between the currency baskets for the last 1000 bars on the M1 chart:
InpDepth = 1000InpPeriod - PERIOD_M1InpExpression = "3 * EURUSD * 1.5 * AUDUSD * GBPUSD - (5 * AUDGBP - 2 * EURGBP) * 1.2 * CHFGBP"
This results in a chart of the synthetic pair, with the condition of buying 3 lots of EURUSD, 1.5 lots of AUDUSD and so on.
Idea of the indicator has been adopted from and MS Excel.

![[EA] Charles-1. 3. 3](/images/10768.webp)