ms-Candle-Index. Indicator of the strength of the direction of the candle
This tool for MetaTrader 5 is specifically engineered to streamline your trading operations. This technical indicator acts as a specialized analysis tool designed to visualize market data. It helps traders identify emerging trends, momentum shifts, and key support or resistance levels by plotting statistical calculations directly onto price charts.
How to Setup and Use ms-Candle-Index. Indicator of the strength of the direction of the candle
1. Installation: Place your file in the MQL/Indicators folder via "Open Data Folder" and restart your terminal.
2. Loading: Find the indicator in the Navigator, drag it onto your chart, and configure the input parameters in the popup window.
3. Customization: Press Ctrl+I to open the indicator list, select your tool, and click "Properties" to change colors, levels, or visual styles.
4. Updating: Replace the old file in the Indicators folder with the new version and restart the platform to apply changes.
Frequently Asked Questions
Q: Why is my indicator not showing? A: Verify the file is in the MQL/Indicators folder, or try right-clicking the "Indicators" tree in the Navigator and clicking "Refresh."
Q: Do custom indicators slow down the platform? A: Too many complex indicators can impact performance; remove unused ones via the "Indicator List" (Ctrl+I).
Q: Can I use MT4 indicators on MT5? A: No, MQL4 and MQL5 are distinct languages; ensure the indicator is compiled specifically for your platform version.
Description & Settings
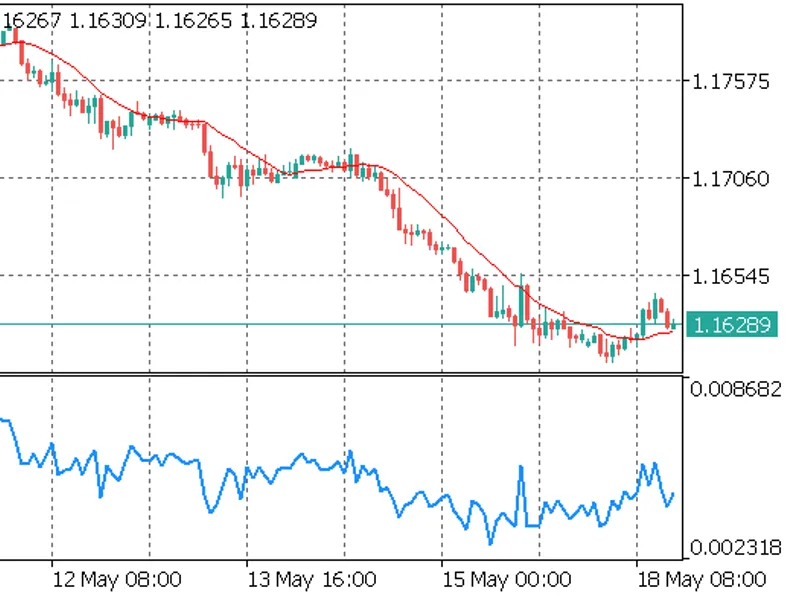
Visually, each bar is described by two states of the histogram column: 1. According to the index sign of the candle - exterior color (red / green) 2. By relative with the value on the previous bar, the change in the index excluding the current sign bar (light green / light red).
So for the candle up (index in the "+" zone) the column will be green. If this is relative the index grows, then the internal column will be painted in light green color, if it falls - light red. For a candle down the principle is similar. If the relative index change is 0, then the internal column not drawn and the color of the index becomes full - green or red.
Yellow line is the MA of the values of CI, blue - MA from changes in CI (1 derivative).
What is the difference from the ms-Candle indicator? What is the meaning of it? In certain situations, at a certain moment it is IMPORTANT to "see" that the direction of price movement is already beginning to change, but not only the fact of his change. For use in MT4, change the extension of file ms-candle-index to mq4, and paste MQL5\Include\SmoothAlgorithms45.mqh tofolder MQL4\Include or download .