PD Fma
This professional-grade solution for MetaTrader 5 helps traders achieve greater efficiency in their daily workflow. This technical indicator acts as a specialized analysis tool designed to visualize market data. It helps traders identify emerging trends, momentum shifts, and key support or resistance levels by plotting statistical calculations directly onto price charts.
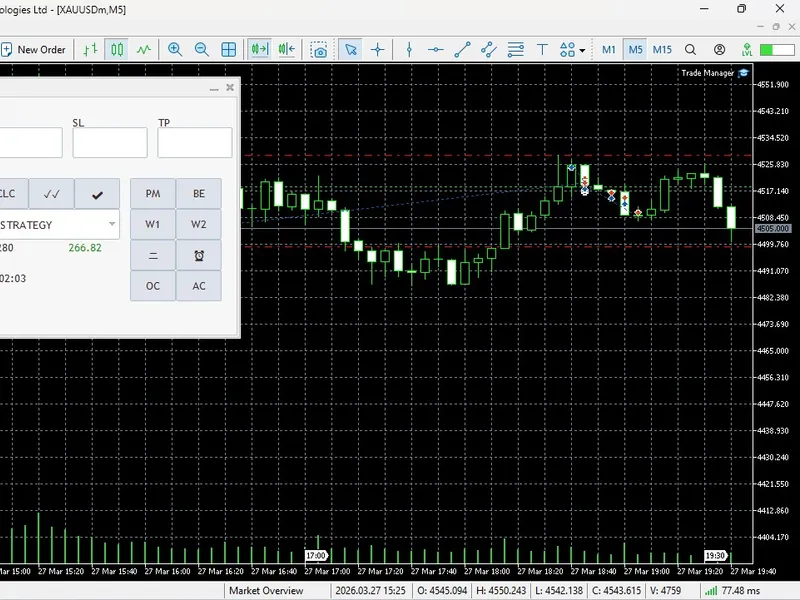
How to Setup and Use PD Fma
1. Installation: Place your file in the MQL/Indicators folder via "Open Data Folder" and restart your terminal.
2. Loading: Find the indicator in the Navigator, drag it onto your chart, and configure the input parameters in the popup window.
3. Customization: Press Ctrl+I to open the indicator list, select your tool, and click "Properties" to change colors, levels, or visual styles.
4. Updating: Replace the old file in the Indicators folder with the new version and restart the platform to apply changes.
Frequently Asked Questions
Q: Why is my indicator not showing? A: Verify the file is in the MQL/Indicators folder, or try right-clicking the "Indicators" tree in the Navigator and clicking "Refresh."
Q: Do custom indicators slow down the platform? A: Too many complex indicators can impact performance; remove unused ones via the "Indicator List" (Ctrl+I).
Q: Can I use MT4 indicators on MT5? A: No, MQL4 and MQL5 are distinct languages; ensure the indicator is compiled specifically for your platform version.
Description & Settings
In short, this is a kind of weighted average (or a digital filter, depends how somebody prefers to call it) that is using probability density function to calculate the coefficients and the average. The short description of PDF is :
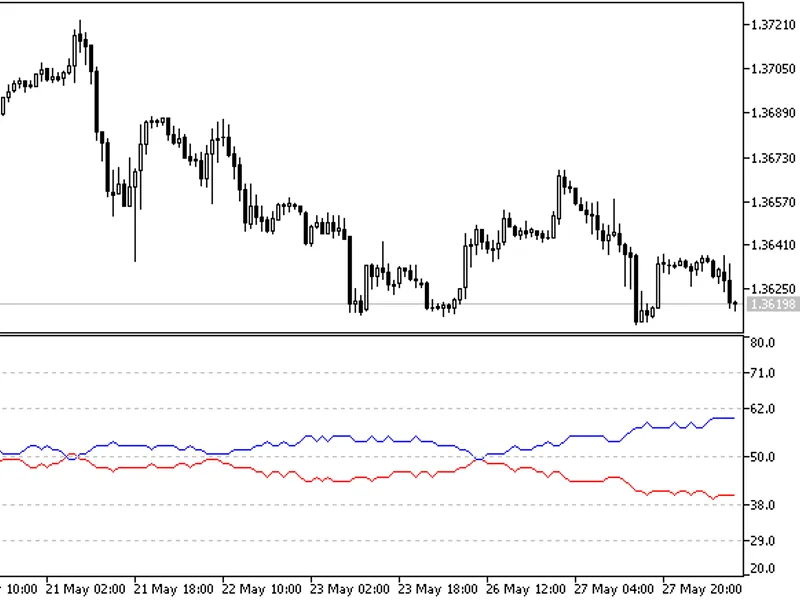
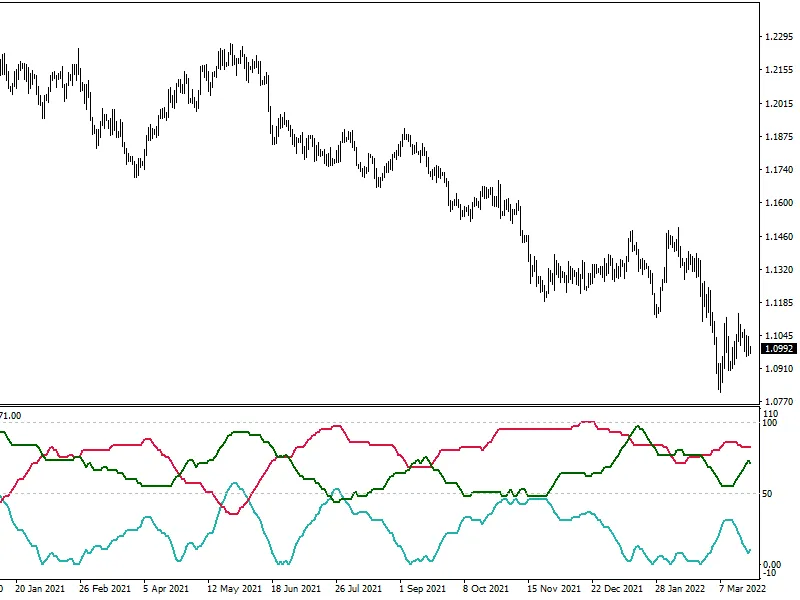
Indicator has the usual set of options - 3 types of levels :
floating
quantile
or no levels (when it switches to "on slope" mode)
Color (and alerts) choices :
on outer levels cross
on middle levels cross
on slope change
It uses the usual set of prices + heiken ashi prices and i multi time frame already.
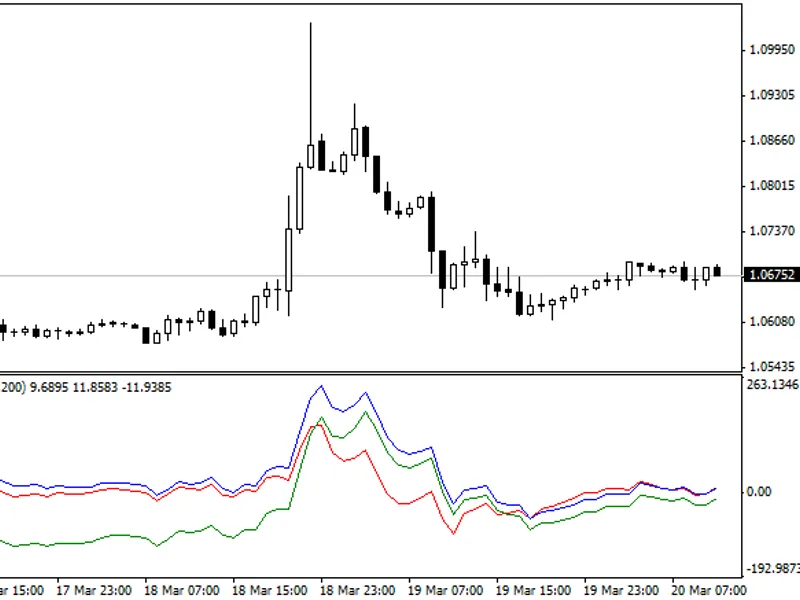
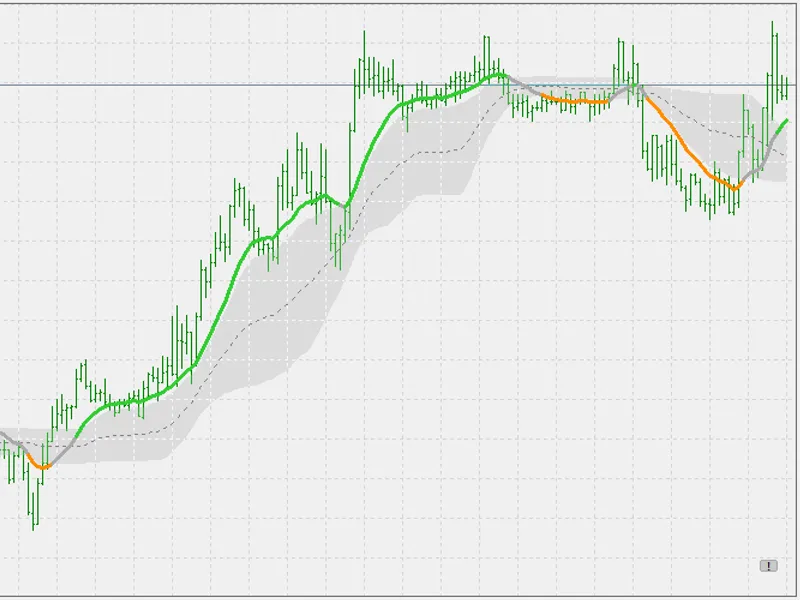
What might be obscure are the variance and mean parameter.
In general both are affecting the "speed" of the PDFma. Variance can be used in a range from 0 to 1. the smaller the variance the "faster" (and less smooth) the PDFma is (lower example is using variance 1 for the green value and variance 0.5 for orange value).
Mean is doing similar, except it uses values in a range from -1 to 1. Lower example green is using mean value of 1 and the orange is using mean -1.
In any case there is a plenty of room for experimenting with this type of filter/average.