DOWNLOAD all MT5 indicators (5649)

Similar MetaTrader Tools
MT4 Experts


MT4 Indicators


MT5 Indicators

Parabolic SA R
Info
The Parabolic SA R is a Indicator for MetaTrader 5 that parabolic sar technical indicator was developed for analyzing the trending markets. The indicator is constructed on the price chart.
Usage
This tool is typically used for enhancing chart analysis and decision making.
Platform
This Indicator works exclusively on MetaTrader 5 (both build 600+ and newer versions).
Setup
Place the downloaded file in MQL5/Indicators folder via File ? Open Data Folder in MetaTrader 5.
How to Install and Use Parabolic SA R
1. Installation: Place your file in the MQL/Indicators folder via "Open Data Folder" and restart your terminal.
2. Loading: Find the indicator in the Navigator, drag it onto your chart, and configure the input parameters in the popup window.
3. Customization: Press Ctrl+I to open the indicator list, select your tool, and click "Properties" to change colors, levels, or visual styles.
4. Updating: Replace the old file in the Indicators folder with the new version and restart the platform to apply changes.
Frequently Asked Questions
Q: Why is my indicator not showing? A: Verify the file is in the MQL/Indicators folder, or try right-clicking the "Indicators" tree in the Navigator and clicking "Refresh."
Q: Do custom indicators slow down the platform? A: Too many complex indicators can impact performance; remove unused ones via the "Indicator List" (Ctrl+I).
Q: Can I use MT4 indicators on MT5? A: No, MQL4 and MQL5 are distinct languages; ensure the indicator is compiled specifically for your platform version.
What this tool does
Parabolic SAR technical indicator was developed for analyzing the trending markets.
Typical Use Case
This Indicator excels in automated trading and technical analysis on MetaTrader 5.
Compatible Platform & Setup
This Indicator works on MetaTrader 5. Place the file in the MQL5/Indicators folder and restart the terminal.
Description & Settings
Related: Color Parabolic 2 - another powerful indicator for MetaTrader 5 traders.
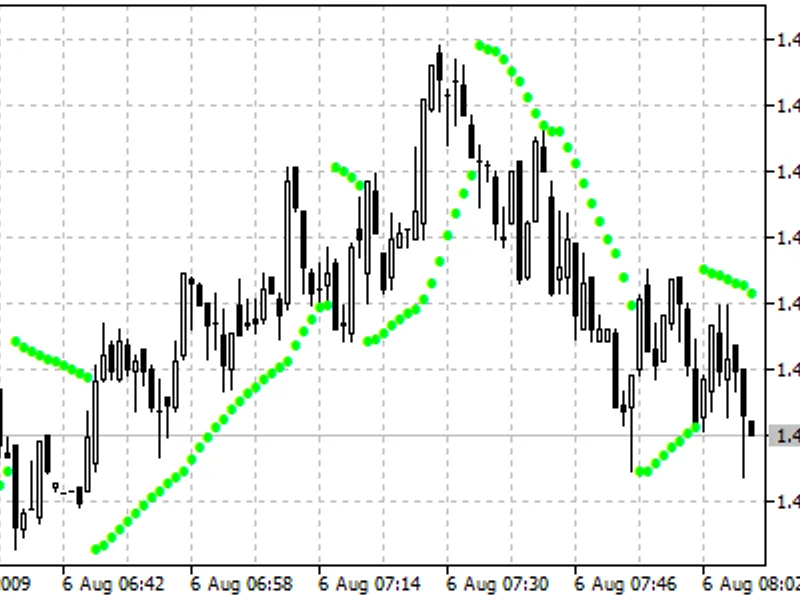
Parabolic SAR technical indicator was developed for analyzing the trending markets. The indicator is constructed on the price chart. This indicator is similar to Moving Average with the only difference that Parabolic SAR moves with higher acceleration and may change its position in terms of the price. The indicator is below the prices on the bull market (Up Trend), when it’s bearish (Down Trend), it is above the prices.
Also recommended: Color Parabolic SA R - similar indicator with strong performance on MetaTrader 5.
If the price crosses Parabolic SAR lines, the indicator turns, and its further values are situated on the other side of the price. When such an indicator turn does take place, the maximum or the minimum price for the previous period would serve as the starting point. When the indicator makes a turn, it gives a signal of the trend end (correction stage or flat), or of its turn.The Parabolic SAR is an outstanding indicator for providing exit points. Long positions should be closed when the price sinks below the SAR line, short positions should be closed when the price rises above the SAR line. It means one should trace the movement of Parabolic SAR and hold open positions only in the direction of this movement. It is often the case that the indicator serves as a trailing stop line.If the long position is open (i.e., the price is above the SAR line), the Parabolic SAR line will go up, regardless of what direction the prices take. The length of the SAR line movement depends on the scale of the price movement.
Parabolic SAR indicator
Calculation:
For long positions:
SAR (i) = SAR (i - 1) + ACCELERATION * (HIGH (i - 1) - SAR (i - 1))
For short positions:
SAR (i) = SAR (i - 1) + ACCELERATION * (LOW (i - 1) - SAR (i - 1))
where:
SAR (i - 1) - value of Parabolic SAR on the previous bar;
ACCELERATION - acceleration factor;
HIGH (i - 1) - maximum price for the previous period;
LOW (i - 1) - minimum price for the previous period.
The indicator value increases if the price of the current bar is higher than previous bullish and vice versa. The acceleration factor (ACCELERATION) will double at the same time, which would cause Parabolic SAR and the price to come together. In other words, the faster the price grows or sinks, the faster the indicator approaches the price.
You may also like: Zig Zag on Parabolic - excellent alternative for indicator users on MetaTrader 5.
⚠ Limitations & Risk Warning
- This tool is provided for educational and testing purposes only.
- Past performance does not guarantee future results.
- Trading involves substantial risk of loss. Use on a demo account first.
- Results may vary depending on market conditions, broker, and settings.
- We recommend thorough backtesting and forward testing before using with real funds.