Automatic Parabolic Support and Resistance Levels Indicator
This professional-grade solution for MetaTrader 4 helps traders achieve greater efficiency in their daily workflow. This technical indicator acts as a specialized analysis tool designed to visualize market data. It helps traders identify emerging trends, momentum shifts, and key support or resistance levels by plotting statistical calculations directly onto price charts.
How to Setup and Use Automatic Parabolic Support and Resistance Levels Indicator
1. Installation: Place your file in the MQL/Indicators folder via "Open Data Folder" and restart your terminal.
2. Loading: Find the indicator in the Navigator, drag it onto your chart, and configure the input parameters in the popup window.
3. Customization: Press Ctrl+I to open the indicator list, select your tool, and click "Properties" to change colors, levels, or visual styles.
4. Updating: Replace the old file in the Indicators folder with the new version and restart the platform to apply changes.
Frequently Asked Questions
Q: Why is my indicator not showing? A: Verify the file is in the MQL/Indicators folder, or try right-clicking the "Indicators" tree in the Navigator and clicking "Refresh."
Q: Do custom indicators slow down the platform? A: Too many complex indicators can impact performance; remove unused ones via the "Indicator List" (Ctrl+I).
Q: Can I use MT4 indicators on MT5? A: No, MQL4 and MQL5 are distinct languages; ensure the indicator is compiled specifically for your platform version.
Description & Settings
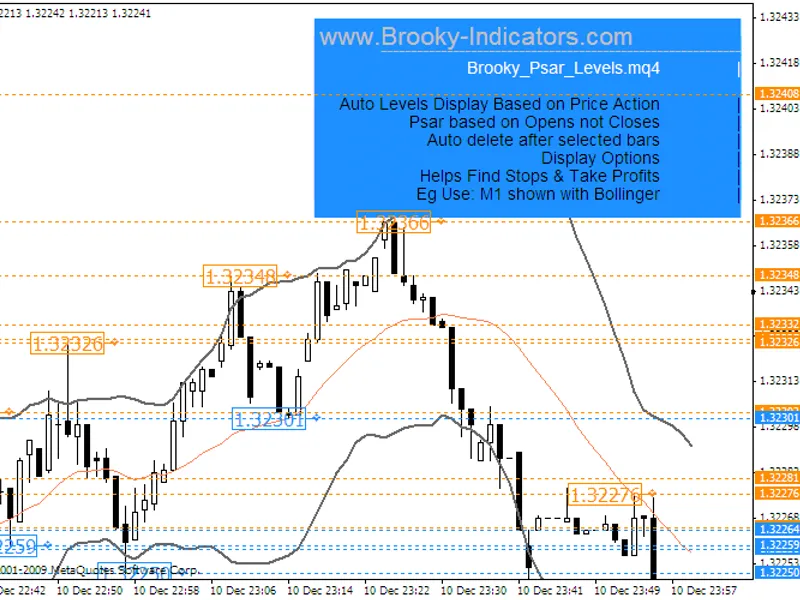
This indi will draw the levels and then delete if older than your selected bars. The turn is calculated on above/below opens not closes as that seems to get most of the turns and this makes it slightly different than just the dots from a programing point of view.
I prepared a video to show it in use with Bollinger bands as this seemed to illustrate how the indi worked quite well. You can have a look if you like here>>. .
Very basically the more previous crosses in bars past that are close together show the strength of the resistance/support level. I have noticed that price tends to want to break
into clear ground which is easy to see as clear chart area.