Parabolic SA R
This software component for MetaTrader 4 is built to enhance the capabilities of your trading environment. This technical indicator acts as a specialized analysis tool designed to visualize market data. It helps traders identify emerging trends, momentum shifts, and key support or resistance levels by plotting statistical calculations directly onto price charts.
How to Setup and Use Parabolic SA R
1. Installation: Place your file in the MQL/Indicators folder via "Open Data Folder" and restart your terminal.
2. Loading: Find the indicator in the Navigator, drag it onto your chart, and configure the input parameters in the popup window.
3. Customization: Press Ctrl+I to open the indicator list, select your tool, and click "Properties" to change colors, levels, or visual styles.
4. Updating: Replace the old file in the Indicators folder with the new version and restart the platform to apply changes.
Frequently Asked Questions
Q: Why is my indicator not showing? A: Verify the file is in the MQL/Indicators folder, or try right-clicking the "Indicators" tree in the Navigator and clicking "Refresh."
Q: Do custom indicators slow down the platform? A: Too many complex indicators can impact performance; remove unused ones via the "Indicator List" (Ctrl+I).
Q: Can I use MT4 indicators on MT5? A: No, MQL4 and MQL5 are distinct languages; ensure the indicator is compiled specifically for your platform version.
Description & Settings
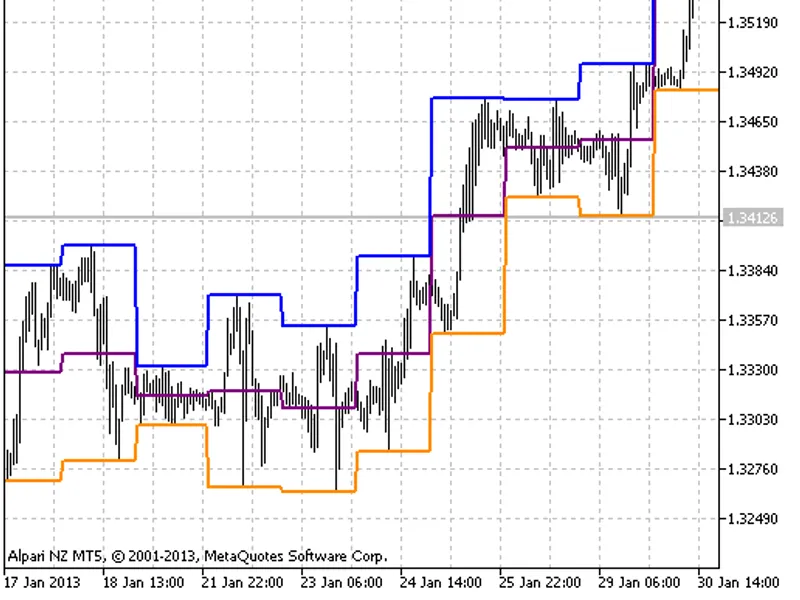
Parabolic SAR Technical Indicator was developed for analyzing the trending markets. The indicator is constructed on the price chart. This indicator is similar to Moving Average with the only difference that Parabolic SAR moves with higher acceleration and may change its position in terms of the price. The indicator is below the prices on the bull market (Up Trend), when the market is bearish (Down Trend), it is above the prices.
Parabolic SAR
If the price crosses the Parabolic SAR lines, the indicator reverses, and its further values are located on the other side of the price. In case of such an indicator reversal, the reference point is the previous period's high or low. The reversal of the indicator signals either the end of a trend (switch to correction or flat) or its reversal.
The Parabolic SAR is an outstanding indicator for providing exit points. Long positions should be closed when the price sinks below the SAR line, short positions should be closed when the price rises above the SAR line. The indicator is often used as the trailing stop line.
If a long position is open (i.e. the price is above Parabolic SAR), then the indicator line will move up irrespective of the price movement. The amount of movement of the Parabolic SAR line depends on the value of the price movement.
Calculation
For long positions:
SAR (i) = ACCELERATION * (HIGH (i - 1) - SAR (i - 1)) + SAR (i - 1)
For short positions: SAR (i) = ACCELERATION * (LOW (i - 1) - SAR (i - 1)) - SAR (i - 1)
Where: SAR (i - 1) — value of Parabolic SAR on the previous bar; ACCELERATION — acceleration factor; HIGH (i - 1) — the high price for the previous period; LOW (i - 1) — the low price for the previous period.
The indicator value increases if the price of the current bar is higher than previous bullish and vice versa. The acceleration factor (ACCELERATION) will double at the same time, which would cause Parabolic SAR and the price to come together. In other words, the faster the price grows or sinks, the faster the indicator approaches the price.
Description of the technical indicator
The full description of the Parabolic SAR is available in the Technical analysis: Parabolic SAR section